1. Calculate all initial reaction rates for all of your data in Part B using an Excel spreadsheet. You should plot all of your data to see how linear it is and to determine if any points need to be dropped by visual inspection. Remember that the initial rate condition, where rate equals the slope of a line, is only true very early in the reaction when [S] ≈ [S]o. Later in your time course plot, we expect the initial slope to get smaller and smaller as [S] decreases. For this reason, you are justified in dropping later time points for the fastest reactions. In some cases, you may only be able to use the first 30 or 40 seconds. Plot each timecourse data set and apply a trendline. Monitor the y-intercept and the fit of the trendline as you are judging how many later time points to drop. Remember, your goal is to best approximate an initial rate measurement, not to improve R2.
Once you have decided how many data points to use for each condition, use the SLOPE function (SLOPE(y_values,x_values)) to determine slopes (ΔA400/Δsec) from your data.
2. Convert your slopes to activity in Catecholase Units (CU):
$$ Activity = \frac{\Delta A_{400}}{\Delta time \text{ (sec)}} \times \frac{60 \text{ sec}}{1 \text{ min}} \times \frac{1 \textit{ CU}}{1 A_{400} \cdot \mu\text{L} \cdot \text{ min}^{-1}} \times \textit{Volume of assay} \text{ (in } \mu\text{L)} \tag{5} $$3. Convert CU to relative activity (CU/μL):
$$ \textit{Relative Activity } (v_o) = \frac{\textit{Activity } \text{(in CU)}}{\textit{Volume of enzyme added } \text{(} \mu\text{L)}} \tag{6} $$4. If you started your reactions by adding undiluted enzyme solution, skip to step 5. If diluted your enzyme before adding it to the tube, calculate Relative Activity of your undiluted sample:
$$ \textit{Undiluted Relative Activity } C_1 = \frac{(\textit{Dilute Relative Activity } C_2) \times (\textit{Dilute Total Volume } V_2)}{\textit{Volume of sample added } V_1} \tag{7} $$5. In this step, you will generate an Eadie-Hofstee plot containing your data with and without inhibitor. Arrange your data from Lab 5 and Lab 6 such that you have a two sets of columns containing concentrations and rates, one set without inhibitor and one set with inhibitor. Next, use Excel to generate columns for vo /[S] on the left and vo on the right. If you arrange the columns as shown below, highlight the data as shown in the blue box, creating a scatter plot will automatically create an Eadie-Hofstee plot with a correctly labeled legend, vo /[S] on the x-axis, and vo on the y-axis for your data with and without inhibitor.
If your Eadie-Hofstee trend for your inhibited data looks like a backward C-shape (i.e. the linear trend curves to the left as you follow it from fastest to slowest rates), contact your instructor. Some inhibitors of mushroom tyrosinase have slow binding equilibria that can lead to a distorted Michaelis-Menten trend under certain conditions.3 It is possible to process your data to correct for this known phenomenon.
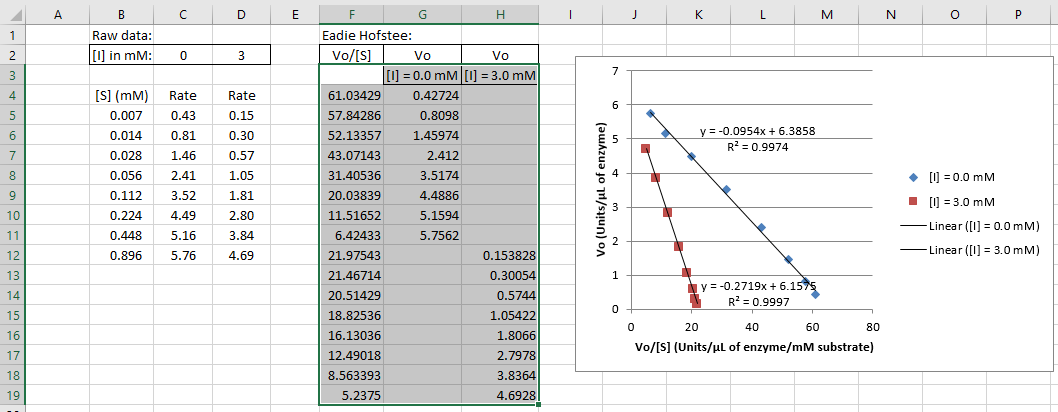
6. Add linear trendlines. In the Trendline Options, you should check "Display R-squared value on chart" so that you can check these values against the calculations in the following step. Delete the equations and R2 values when you use this plot for Figure 2 in Report 2.
7. Use the LINEST function to calculate the slope and y-intercept parameters with their respective uncertainty values to determine the kinetics parameters you did in Step 6 of Lab 5. You will need the three kinetic parmeters determined without inhibitor: Vmax, Km, and Vmax/Km . You will also need the three kinetics parameters determined with inhibitor: (Vmax)app, (Km)app, and (Vmax/Km)app. When you report your apparent Vmax and apparent Km report the standard errors given by the LINEST function as your uncertainty. The uncertainty for your apparent Vmax/Km estimate will propagated as the square root of the sum of the squares of the relative errors for the slope and intercept as explained in the Writing Guidelines.
8. Refer the Background for this Lab to determine the mechanism of inhibition from the intersection of the lines in the Eadie-Hofstee plot. If the two Vmax values or the two Vmax/Km values are different, but lie within their ranges of uncertainty, you should treat them as identical.
9. Based on your selected inhibition mechanism, calculate either the Ki or Kie and Kies if mechanism is mixed inhibition. Calculate Ki values in μM units and convert your literature value to the same units for comparison. Make sure to use the actual concentration of inhibitor in your assays rather than the 100 μM stock concentration. When calculating Ki, you must divide two measured kinetics parameters. Therefore, to calculate the uncertainty in Ki, once again propagate the square root of the sum of the squares of the relative errors as explained in the Writing Guidelines.
10. Report your data on your lab section's data spreadsheet on the D2L Main Page.