Lecture Video
Materials
- Sodium phosphate buffer, 50 mM at pH 6.5
- Mushroom tyrosinase samples:
- The commercial tyrosinase sample is 0.1 mg/ml Agaricus bisporus tyrosinase (Sigma-Aldrich Corp.) dissolved in the same same buffer as above. It is apparently the purified dimer since the Sigma reports the molecular weight as: 128 kDa by sedimentation velocity diffusion; 133 kDa by light-scattering measurements, and 119.5 kDa by electrophoresis.
- You also have the option of using your own group's tyrosinase samples from Lab 2.
- Catechol, 50 mM (in 50 mM phosphate buffer at pH 6.5)
- 10% SDS in dissolved 50 mM phosphate buffer at pH 6.5
- A 100 μM solution of either tropolone, salicylhydroxamic acid (SHAM), or kojic acid
- Spectrophotometer set to 400 nm
Part A: Determine the Inhibitor Concentration
Purpose
As was the case last week, you will carry-out some preparatory measurements in Part A to find the conditions to set-up the "actual experiment" in Part B wher you will monitor the rate of the reaction catalyzed by tyrosinase as a function of increasing [S] in the presence of an inhibitor. You will select your inhibitor from those available in class.
After selecting your inhibitor, you will vary [I] while keeping [catechol], [SDS], and [E] constant. Your objective will be to determine the inhibitor concentration that causes ~15-30% inhibition (i.e. enzyme operates at ~70-85% of maximal rate) in the presence of 1.5 mM catechol, 0.1% SDS, with the same concentration of enzyme that you used last week. Just like last week, the total volume of each reaction will be 1000 μL. The [I] you determine here will be used for Part B.
Methods
Copy Table 1 into your notebook with the headings across the long edge so that you have enough space for all of the time points. Dedicate one full notebook page for all data of this week.
First, acquire one kinetics measurement without inhibitor. Use the rate from this assay as your positive control (100% activity).
Your next assays should include varying volumes of inhibitor to discover the volume that gives an activity of ~70-85% of your first activity measurement. Measure at least four inhibitor concentrations. A good starting volume for either SHAM or Tropolone is 40 μL and for Kojic acid is 70 μL.
Table 1. Suggested data table format for keeping track of your experimental conditions.a
|
Sample Name |
[Catechol] stock (mM) |
|
[catechol] volume (μL) |
Inhibitor volume (μL) |
SDS volume (μL) |
Enzyme volume (μL) |
Buffer volume (μL) |
Time |
10 |
20 |
etc... |
|
|
|
|
|
|
|
|
|
|
|
|
|
|
|
|
|
|
|
|
|
|
|
|
|
|
|
|
|
|
|
|
|
|
|
|
|
|
|
a. Copy this table into your notebook with the headings across the long edge. Dedicate a full notebook page for all data of this week.
Part B: Michaelis-Menten Kinetics with Inhibitor
Purpose
Next, you will carry out the actual experiment—measuring the initial rate of tyrosinase reaction as a function of substrate concentration, in the presence of the inhibitor. This time, you will vary [catechol] while keeping [E] and [I] constant at the concentrations that you selected in Part A.
Methods
As you did last week, first prepare eight 2-fold serial dilutions of catechol in 2.0 mL microcentrifuge tubes. Fill the first tube with catetchol stock solution, then transfer 1000 μL into the next tube. Without changing the setting of the pipettor, add 1000 μL of buffer and mix. Then, without changing the setting on the pipettor, transfer 1000 μL of that solution into the next tube. Add 1000 μL of buffer, mix, and repeat until you have eight solutions.
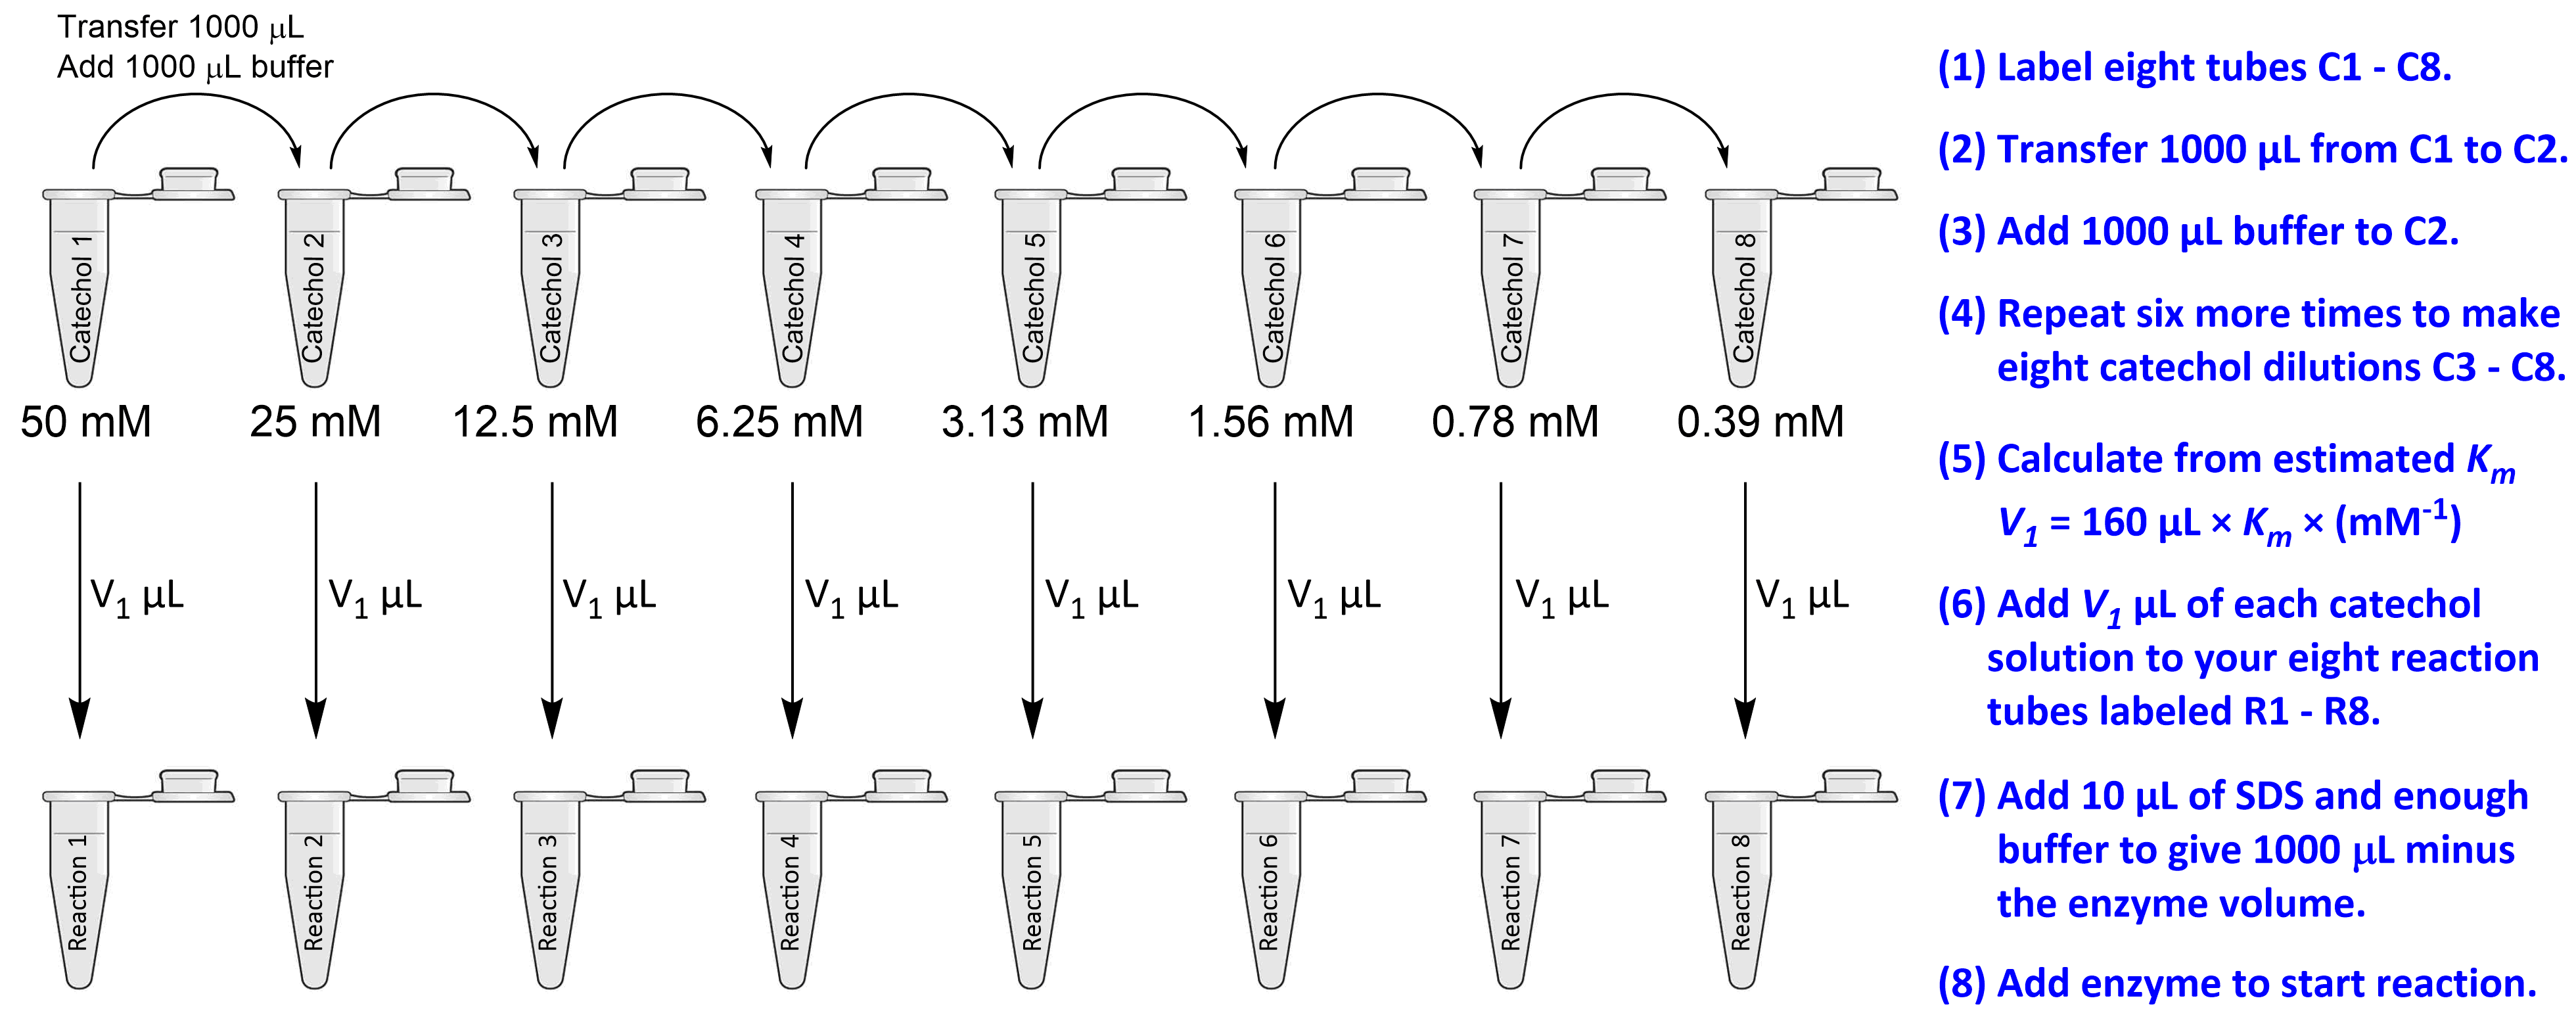
Use the same V1 that you selected in the prior lab to prepare eight kinetics measurements at the same catechol concentrations. Plan your assays in your table so that each will contain: (1) the volume of enzyme extract that you used in Part A, (2) the volume of inhibitor that you used in Part A, (3) 10 μL of 10% SDS, (4) the V1 volume of catechol from the prior lab, and (5) the volume of 50 mM pH 6.5 phosphate buffer required to obtain a 1000 μL reaction. As before, mix buffer, catechol, SDS, and inhibitor in the eight tubes. Add enzyme solution to start each reaction. Mix and measure the initial rates for these reactions at 400 nm. You may need to collect more time points for low substrate reactions that are very slow.