Download the Lab 8 Assignment Worksheet from the D2L Main Page.
You will complete this worksheet as a Word document and post an electronic copy to the appropriate D2L Submissions folder. Please do not convert the worksheet document to a different format.
The instructions below provide the expectations for complete answers.
Gel images for your lab section are found in the Images link in the Student Data area of the Main Page.
Prompts 1–2: Lab 7 Gel image
- A complete caption for an agarose gel must state the percent agarose, identity of the running buffer, staining methodology, approximate sample mass of DNA loaded per lane, identity of lanes (i.e. DNA ladder or plasmid samples), and identity of important bands in reference ladder.
Prompts 3–4: Lab 7 DNA yield
- To calculate the concentration of DNA, multiply the measured Absorbance at 260 nm by 50 ng/μL.
- To estimate the total plasmid yield, multiply your measured plasmid concentration (in ng/μL) by the eluted volume (in μL). If this value in ng is large, convert to μg.
- To evaluate success, you need to know that the expected yield of extracted plasmid as described in Bimboim 1979 is about 1 μg of low copy number plasmid DNA from the 1 mL of culture (the amount of culture we used).3 Our plasmid is known to be a low copy number plasmid (10-50 copies per cell). According to the manual for our kit, the spin column capacity is 20 μg of plasmid DNA.6 This is the upper limit of how much plasmid DNA we can isolate.
- Refer to the DNA characterization background page for help interpreting A260/A280 and A260/A230. When you explain these results, specify the type of contaminant suggested by each ratio.
Prompts 5–9: Lab 8 Restriction digest results
- A complete caption for an agarose gel must state the percent agarose, identity of the running buffer, staining methodology, approximate sample mass of DNA loaded per lane, identify the enzymes in each lane, and identity of important bands in reference ladder.
- The Analysis page of this lab explains how to generate Figure 3, Table 3, and Figure 4.
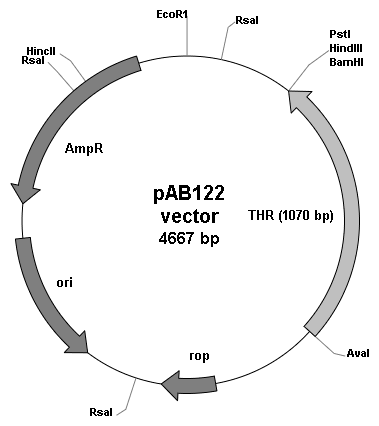
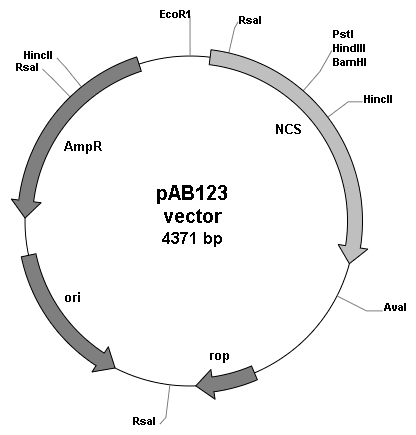
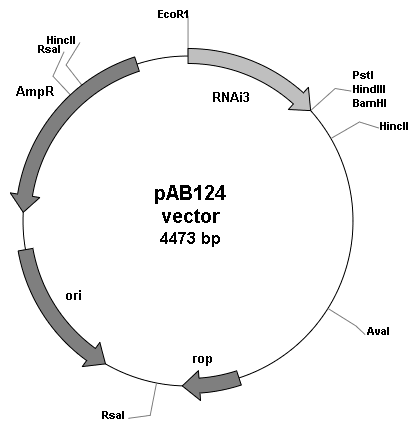
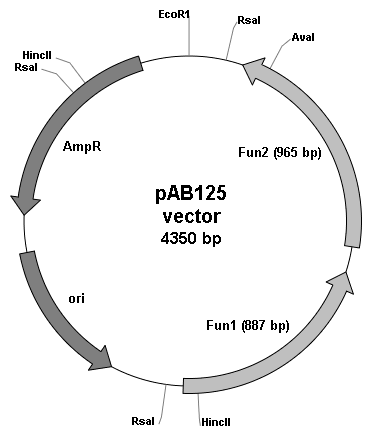
- For Figure 4, use one of these graphics of the four possible plasmids: pAB122, pAB123, pAB124, or pAB125. You do not need to draw the plasmid map from scratch.
- In prompt 9, you must explain the logic of your plasmid assignment using the results from at least three lanes. Comment on any unexpected bands or fragment lengths for the lane data that you use.
The Four Possible Plasmid Maps
 |
 |
 |
 |