Background
Suggested Reading
- Wilson and Walker 4.7.4 Electrophoresis of nucleic acids
Lecture Video
DNA Characterization
After isolation, you will characterize the concentration and purity of your DNA. DNA has significant absorption in the UV range because of the presence of the aromatic bases.


The major absorption band for purified DNA peaks at about 260 nm. Unlike protein, the extinction coefficient of DNA is very predictable. The ε260 of double-stranded DNA is 20 μL·μg-1cm-1. So using Beers Law: c = A/(ε∙l) to get a concentration, you merely need to multiply the measured Absorbance at 260 nm by 50 ng/μL.
Protein, the primary contaminant in isolated DNA, has peak absorption at 280 nm. Thus, the ratio A260/A280 is often used as a relative measure of the extent of protein contamination of a DNA sample. As seen in the table below, DNA also absorbs weakly at 280 nm (and protein also absorbs weakly at 260 nm).2
|
|
Extinction at 260 nm (μL·ug-1cm-1) |
Extinction at 280 nm (μL·ug-1cm-1) |
|
DNA |
20 |
10 |
|
Protein |
0.57 |
1.00 |
In relative terms, nucleic acid samples are expected to have a higher absorbance at 260 nm than at 280 nm, the inverse is expected for protein. Using these extinction coefficients, pure nucleic acid samples would has an A260/A280 ratio of 2.0, while pure protein is 0.57. Samples that contain a mixture of protein and DNA are influenced by both macromolecules. The theoretical A260/A280 ratio for samples that contain a mixture of protein and nucleic acid can be estimated by using the following formula: A260/A280 = (ε260 × (%P) + ε260n × (%N). To help you estimate your DNA purity, this function is plotted below.
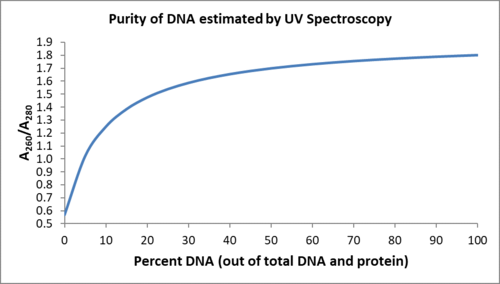
Notice that the A260/A280 ratio is more sensitive to protein contaminated with nucleic acids and is less sensitive to nucleic acids contaminated with protein. For pure DNA, A260/A280 is 1.8 and for pure RNA A260/A280 is 2.0. Thus, values of this ratio that exceed 1.9 typically indicate that the sample is contaminated by either RNA or phenol (which also absorbs strongly around 270 nm) and values that are less than 1.7 indicate more than 50% protein contamination.7
The A260/A230 ratio reveals contamination by organic molecules. Most organic molecules (e.g. including ethanol, EDTA, protein etc.) absorb at 230 nm. For DNA that is free of contamination by organics, the A260/A230 ratio 2.1. Thus, any ratio less than 2.0 indicates organic contamination. If the A260/A280 ratio revealed high protein contamination, then much of the absorbance at A260 is likely to be protein as well.8
A significant deviation of your A230:A260:A280 ratio from 1:1.8:1, lowers the confidence of your concentration estimate. In practice, these ratios cannot be interpreted quantitatively because the nucleic acid spectrum is relatively steep at A280. For this reason, differences in slit widths on different spectrophotometers can create A260/A280 variation as much as ±0.2. In addition, the extinction coeffients for double stranded DNA are very temperature sensitive, creating A260/A280 variation as much as ±0.1 between just 20 °C and 30 °C. The ratios of A230:A260:A280 should only be interpreted as a qualitative measure of the confidence in your DNA concentration measurement.
Gel Electrophoresis
 A second method that will be employed to assess the success of your DNA isolation is by running the purified DNA on a gel. Like the PAGE gels you ran on the tyrosinase extracts, DNA gel electrophoresis uses an electric current to push the samples through a matrix (agarose), separating the DNA into bands based on their sizes (number of bases).
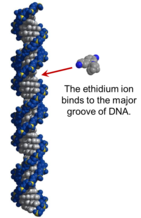
DNA gels are visualized similarly to PAGE gels as well; however instead of coomassie, a fluorescent, DNA-binding dye called ethidium bromide (EtBr) is the most common DNA staining reagent. EtBr intercalates into the major groove of the DNA double helix, and fluoresces under UV light upon DNA binding. This allows for visualization of the DNA bands in the gel by exposing the stained gel to UV radiation.
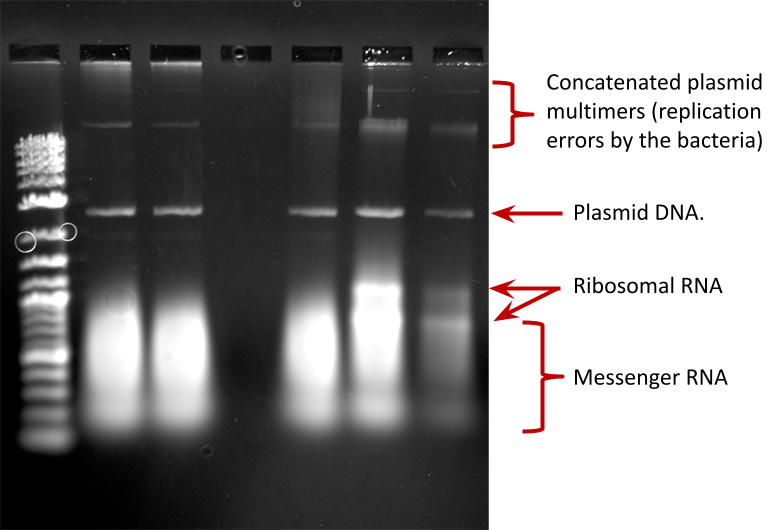
Below you'll see a typical example of an imaged DNA gel after plasmid isolation and EtBr staining. A DNA ladder was loaded in the first well, and the other five, populated wells all show distinctive bands of nucleic acids representing the various types of nucleotides that were isolated from the bacterial cultures. Make note of what bands you would expect to see in your gel if you successfully isolated plasmid DNA from the other nucleotides.