Lecture Video
Electrophoresis
Electrophoresis is the process of separating particles in an electric field. Like PAGE, nearly all of the common forms of electrophoresis conduct separation in a semisolid gel matrix in which the gel consists of an aqueous phase (buffer) and a solid phase composed of a natural or artificial polymer (agarose, polyacrylamide, starch, etc.). The solid phase has two roles: (1) it acts as a "sieve" to separate molecules according to a specific physical or chemical property and (2) it acts as a "trap" to keep separated molecules from diffusing at the conclusion of the electrophoretic treatment.
In an electric field E, a particle of charge q experiences a force (F) of F = qE. That is, a negatively charged molecule will "feel" a force pushing it against the positive-to-negative electric field lines. Any negatively charged molecule migrates toward the "anode" (+) end of the field, while positively charged molecules migrate toward the "cathode" (-) end.
Since DNA is negatively charged, it migrates towards the anode. The rate at which a particular DNA fragment migrates through a gel is determined by its size. The larger the molecule, the more interaction it has with the gel matrix and the slower it moves. Smaller objects slip through the pores of the gel easily, while larger ones become trapped and move through more slowly. The distance traveled during a defined length of time is inversely proportional to the size of the fragment. The actual size of the pores in the gel influences the speed of migration, and thus this can be adjusted by varying the concentration of the matrix in the gel. Agarose, because it is safe, effective, and easy to handle, is the matrix of choice for gels for basic DNA analysis.
Visualization of DNA
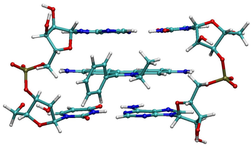 After electrophoresis is completed, the DNA must be stained in order to visualize the separated restriction fragments. The most common method of direct staining is the incubation of the gel in a weak solution of ethidium bromide (EtBr). This compound has UV absorbance maxima at 300 and 360 nm, and can also absorb energy from nucleotides excited at 260nm. This absorbed energy is re-emitted as orange/yellow fluorescence at 590nm. The closer the UV illumination is to 260 nm, the more likely you are to damage the DNA. Illumination ~300 nm gives the strongest fluorescence, however, many researchers illuminate with 360 nm to protect their sample from damage (360 nm gives considerably weaker fluorescence). Ethidium cations have high affinity for binding DNA. In their presence, the DNA dynamically opens a space between its base pairs by unwinding. The ethidium cation unwinds DNA by about 26°. The ion fits into a 0.34 nm (3.4 Å) opening created by this unwinding that is stabilized by hydrophobic interactions between ethidium and the nucleotide bases (see picture). This unwinding induces local structural changes to the DNA strand, such as lengthening of the DNA strand, or twisting of the base pairs. These structural modifications can lead to functional changes, often to the inhibition of transcription and replication and DNA repair processes, which makes intercalators potent mutagens. For this reason, DNA intercalators are generally considered carcinogenic and should be handled with care.
Restriction mapping of plasmid DNA
A plasmid is a DNA molecule that is separate from, and can replicate independently of, the chromosomal DNA. They are double stranded and, in most cases, circular. Plasmids usually occur naturally in bacteria, but are sometimes found in eukaryotic organisms. Last week, we set-up a hypothetical scenario in which the labels have rubbed off of tubes of E. coli each carrying a plasmid that your lab uses for research. The four possible plasmid restriction maps are given below (images are also available on the D2L main page).

On each map, you see the relative locations for where various restriction enzymes cut. The arrows indicate the locations of important genetic features. "AmpR" expresses a protein called beta-lactamase, which confers ampicillin resistance to the bacterium carrying the plasmid. The ampicillin resistance trait is used to select plasmid-containing bacteria that grow in the presence of this antibiotic. The region labeled "ori" is the E. coli "origin of replication," a sequence to which DNA polymerase binds. The origin of replication is required for E. coli to pass the plasmid to daughter cells. The "rop" gene expresses a small protein that helps maintain a high copy number of about 20 plasmids per cell. This feature ensures that we are able to isolate more DNA per cell. The other features express proteins that are of interest to your lab in this hypothetical scenario. They were inserted into the plasmids using methods described in Lehninger Section 9.1.
Look carefully at the differences between the four plasmids. We will use the pattern that results from reaction with restriction enzymes to identify our plasmid. As an example, of what we may see, digests by either EcoRI or AvaI will simply give you a piece that is the size of the entire plasmid because there is only one cut-site for each of them. However, a double digest with both EcoRI and AvaI will allow you to distinguish pAB125 from the others. Plasmid pAB125 will give a large fragment ~4000 bp in length and a small fragment ~300 bp in length. In contrast, the smaller fragment resulting from a double digest with the other three plasmids would be a clearly distinguishable ~1500 bp in length.
Last week you performed a small-scale isolation of plasmid DNA. This week you will map the restriction sites of four available enzymes: EcoRI, AvaI, HincII, and RsaI. You will use the lengths of the DNA fragments resulting from your restriction digests to map their relative locations of the sites on the plasmid. With this information, you will identify your "unknown" plasmid from the four possibilities. You will also complete the map by assigning position numbers to the sites.
Your agarose gel will have a total of ten lanes. Be sure to run appropriate controls on each gel, including single digests to compare with double digests or double digests to be compared with each other. The more digests you have on your gel, the more information you will obtain by comparing fragment sizes directly. You will generate a standard curve of fragment sizes by running a DNA ladder mixture on each gel. Our reference DNA mixture will be "2-log DNA Ladder" (New England Biolabs product N3200). Visit the manufacturer's website for more information on the composition of this DNA reference mixture (link on the D2L main page).
Restriction Endonuclease Enzymes
So what is a restriction enzyme? These enzymes are endonucleases (polynucleotide degrading enzymes) that recognize a specific DNA sequence, and introduce double-stranded cuts. Researchers stumbled upon these enzymes while observing the growth of a bacteriophage virus, and saw that its growth was "restricted" in some bacterial cultures. Upon investigation they found that in these cultures, endonucleases degraded the unmethylated viral DNA upon entry into the bacterial cell, restricting phage growth (hence the name restriction enzyme).1 Methylation of the bacteria's own DNA prevents the enzymes from destroying host DNA, while allowing them to target any foreign DNA that invades the cell.
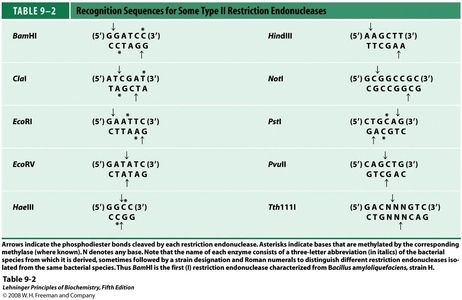
 As can be seen in the table above, there are a multitude of restriction enzymes, each recognizing its own "cut-sequence." These recognition sites are typically 4-8 bases in length, and are usually palindromic (the 5'-3' sequence is the same for top and bottom strands). In the above table, the arrows indicate where the restriction enzyme cleaves the phosphodiester bond in the DNA backbone, with two bonds being hydrolyzed in order to achieve the double-stranded cut. The resulting, cut DNA strands can either form blunt ends (no unpaired bases) or sticky ends (multiple unpaired bases). Sticky ends are of particular use due to their abilities to hydrogen-bond with complementary sequences digested with the same enzyme. As we will see later, this plays a large role in restriction based DNA cloning.
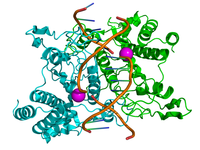
The enzyme shown on the right, EcoRI, gives insight into the palindromic nature of the sequence recognition sites. Restriction enzymes are homodimers, with each subunit recognizing the same sequence of DNA on each strand. The purple balls in this model are Mg2+ ions, which, as you can recall from last week, are essential in stabilizing the negative charges in the enzyme-DNA reaction complex.
Cloning with Restriction Enzymes
It is no understatement to say that the discovery of restriction enzymes revolutionized biochemistry and molecular biology. Advances in DNA technology quickly followed the discovery of restriction enzymes: cloning, DNA fragmentation analysis, and DNA restriciton mapping are only some of the many applications of restriction enzymes.2
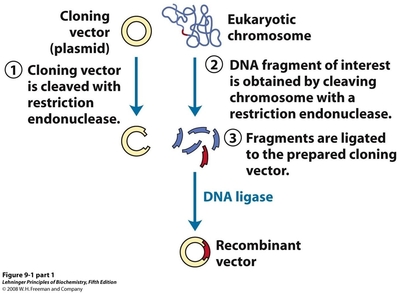
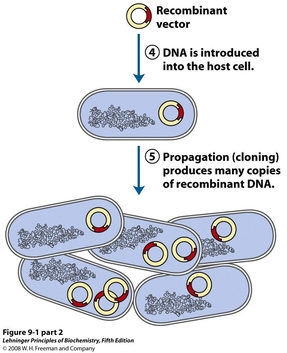
Cloning involves the combination of two or more sets of DNA into one, recombinant piece of DNA. In terms of creating recombinant plasmids, the two DNA pieces are usually a vector backbone (1) and a gene insert (2). The insert encodes for the protein, enzyme, or function of interest while the backbone allows for transformation of the plasmid into bacterial cells, and for replication of the plasmid upon transformation.
In order to perform this type of cloning, both the vector and the insert must be digested with the same enzyme(3). This produces sticky ends on both the vector and the insert which will overlap with each other when combined. The pieces are loosely held in place by these sticky ends, and are ligated together with DNA ligase, which re-forms the phosphodiester bonds in the DNA backbone. The ligated plasmid can then be transformed into a host cell (4), and will copy itself using the replication machinery of the host (5).
This method may seem complicated, but it can be thought of in fairly simple terms. Restriction enzymes act as molecular scissors which cut DNA sequences from two or more sources. The sticky ends generated from these cuts act as a weak adhesive that reversibly associate the insert to the vector. Finally, the DNA ligase acts as a laminate, sealing the two pieces of DNA together with a covalent bond that can not be easily reversed.
DNA Fragmentation Analysis and Plasmid Mapping
Lecture Video
A second application for restriction enzymes in biochemistry is their ability to "map" segments of DNA through their patterns of cleavage. Information about the size and relative locations of restriction cut sites can be found by digesting DNA with a series of restriction enzymes. Running the products of a DNA restriction digest on an electrophoresis gel will allow visualization of the cuts, as the single, large DNA band will turn into multiple, smaller digested bands. This mapping is what you will be carrying out on the unknown plasmid in Lab 8.
How to approach plasmid mapping will be covered in more detail in the Data Analysis section and in the Lecture video (above).
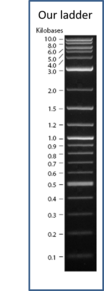
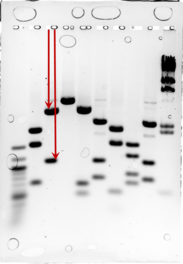
From the gel image, the lengths of the bands can be determined by measuring the distance each band has travelled. First, the migration distances of the ladder bands should be measured and plotted in Excel against the 10 of the number of base pairs. The image to the left gives an indication of how to measure the distances. Make sure you are consistent with your measurements (i.e. start at the bottom of each well, and end at the middle of each band).