1.Visit the link on the D2L Main Page for a key to the lengths of the bands in the 2-log DNA reference ladder. List these lengths in an Excel spreadsheet (see example below).
2. Using your gel image, measure the migration distances in millimeters for the center of the bands in the 2-log DNA reference ladder lane. Assign these values to the matching fragment lengths in your spreadsheet. Refer to the manufacturer's product information (link on the D2L main page) for the reference values. Note that the 0.5, 1.0, and 3.0 kbp bands are higher intensity to help orient you. It is easiest to assign the bands from the bottom of the gel since the ones at the top may not be resolved.
3. Include column of log10 for each fragment length in bp. Use the "=log10()" function.
4. Graph the migration distance (x-axis) against the log10 of base pairs (y-axis) for all reference ladder bands. Add a linear trendline to the graph. You may need to apply another function to the data (use the trendline that gives the best results). This plot will be a figure in your report. Be sure to include both the trendline equation and R2 in the caption.
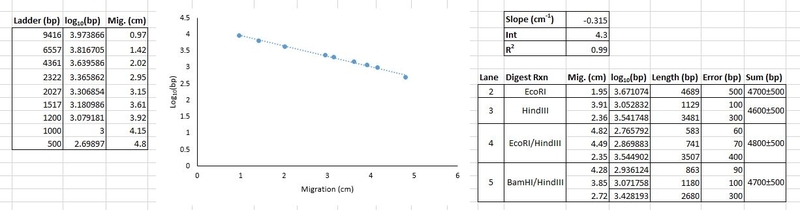
5. Print out your gel image and measure the migration distances in centimeters for the center of the bands in each digest lane. If the prep contained genomic DNA, you should not assign the genomic band (the band that is larger than the highest ladder band). Your migration distance precision should be limited to two decimal places.
6. Use the trendline equation from your plot to calculate the number of base pairs for the fragment(s) from all digests. Prepare a table of these results, sorted by digest experiment (see example table below). For example, using the equation above [y = -0.3154 (cm-1)x (cm) + 4.2862], the log10(length) for the first HindIII band is -0.3154·(3.91 cm) + 4.2862 = 3.0528. Then, 103.0528 = 1129 base pairs. Since it is difficult to get a quantitative estimate of uncertainty using Excel, you should estimate your confidence to the best of your ability. We recommend that you retain two significant digits and estimate your relative uncertainty as 10%. If you do this, a calculated fragment length of 1129 bp becomes 1100 bp. The uncertainty is 10% × 1129 = 112.9. Since the uncertainty should have only one significant digit, this becomes 100. You would report the value as 1100 ± 100 bp.
Include a column for the sum of the band lengths for each lane; these should add roughly to the same value. This will be Table 2 in your worksheet.
|
Lane |
Enzyme(s) |
Migration Distance (cm) |
Length (bp) |
Error (bp) |
Sum (bp) |
|
2 |
EcoRI |
1.95 |
4700 |
500 |
4700 ± 500 |
|
3 |
HindIII |
3.91 |
1100 |
100 |
4600 ± 500 |
|
2.36 |
3500 |
400 |
|||
|
4 |
EcoRI/HindIII |
4.82 |
580 |
60 |
4800 ± 500 |
|
4.49 |
740 |
70 |
|||
|
2.35 |
3500 |
400 |
|||
|
5 |
BamHI/HindIII |
4.28 |
860 |
90 |
4700 ± 500 |
|
3.85 |
1200 |
100 |
|||
|
2.72 |
2700 |
300 |
8. Prepare a restriction map of the plasmid. Your map should match one of the four possible maps given in the Background (graphic files also posted to the D2L Main Page). You should label the restriction cut sites that you evaluated with numbers indicating estimates of the base pair position for each restriction site on your map. Number all positions relative to the EcoRI site, designated as 0 bp. For example, if you saw fragments of 630 bp and 4050 bp in a double digest of pAB122 with EcoRI-PstI, you would label EcoRI as "0" and the PstI site as "630." Note that very small fragments may not be visible and their presence might need to be inferred through subtraction. If your total calculated plasmid length does not exactly match the actual plasmid length, do your best to label the restriction map with the fragment lengths you observed. These labels are only estimates. These labels constitute most of the points for Figure 4 of your worksheet.
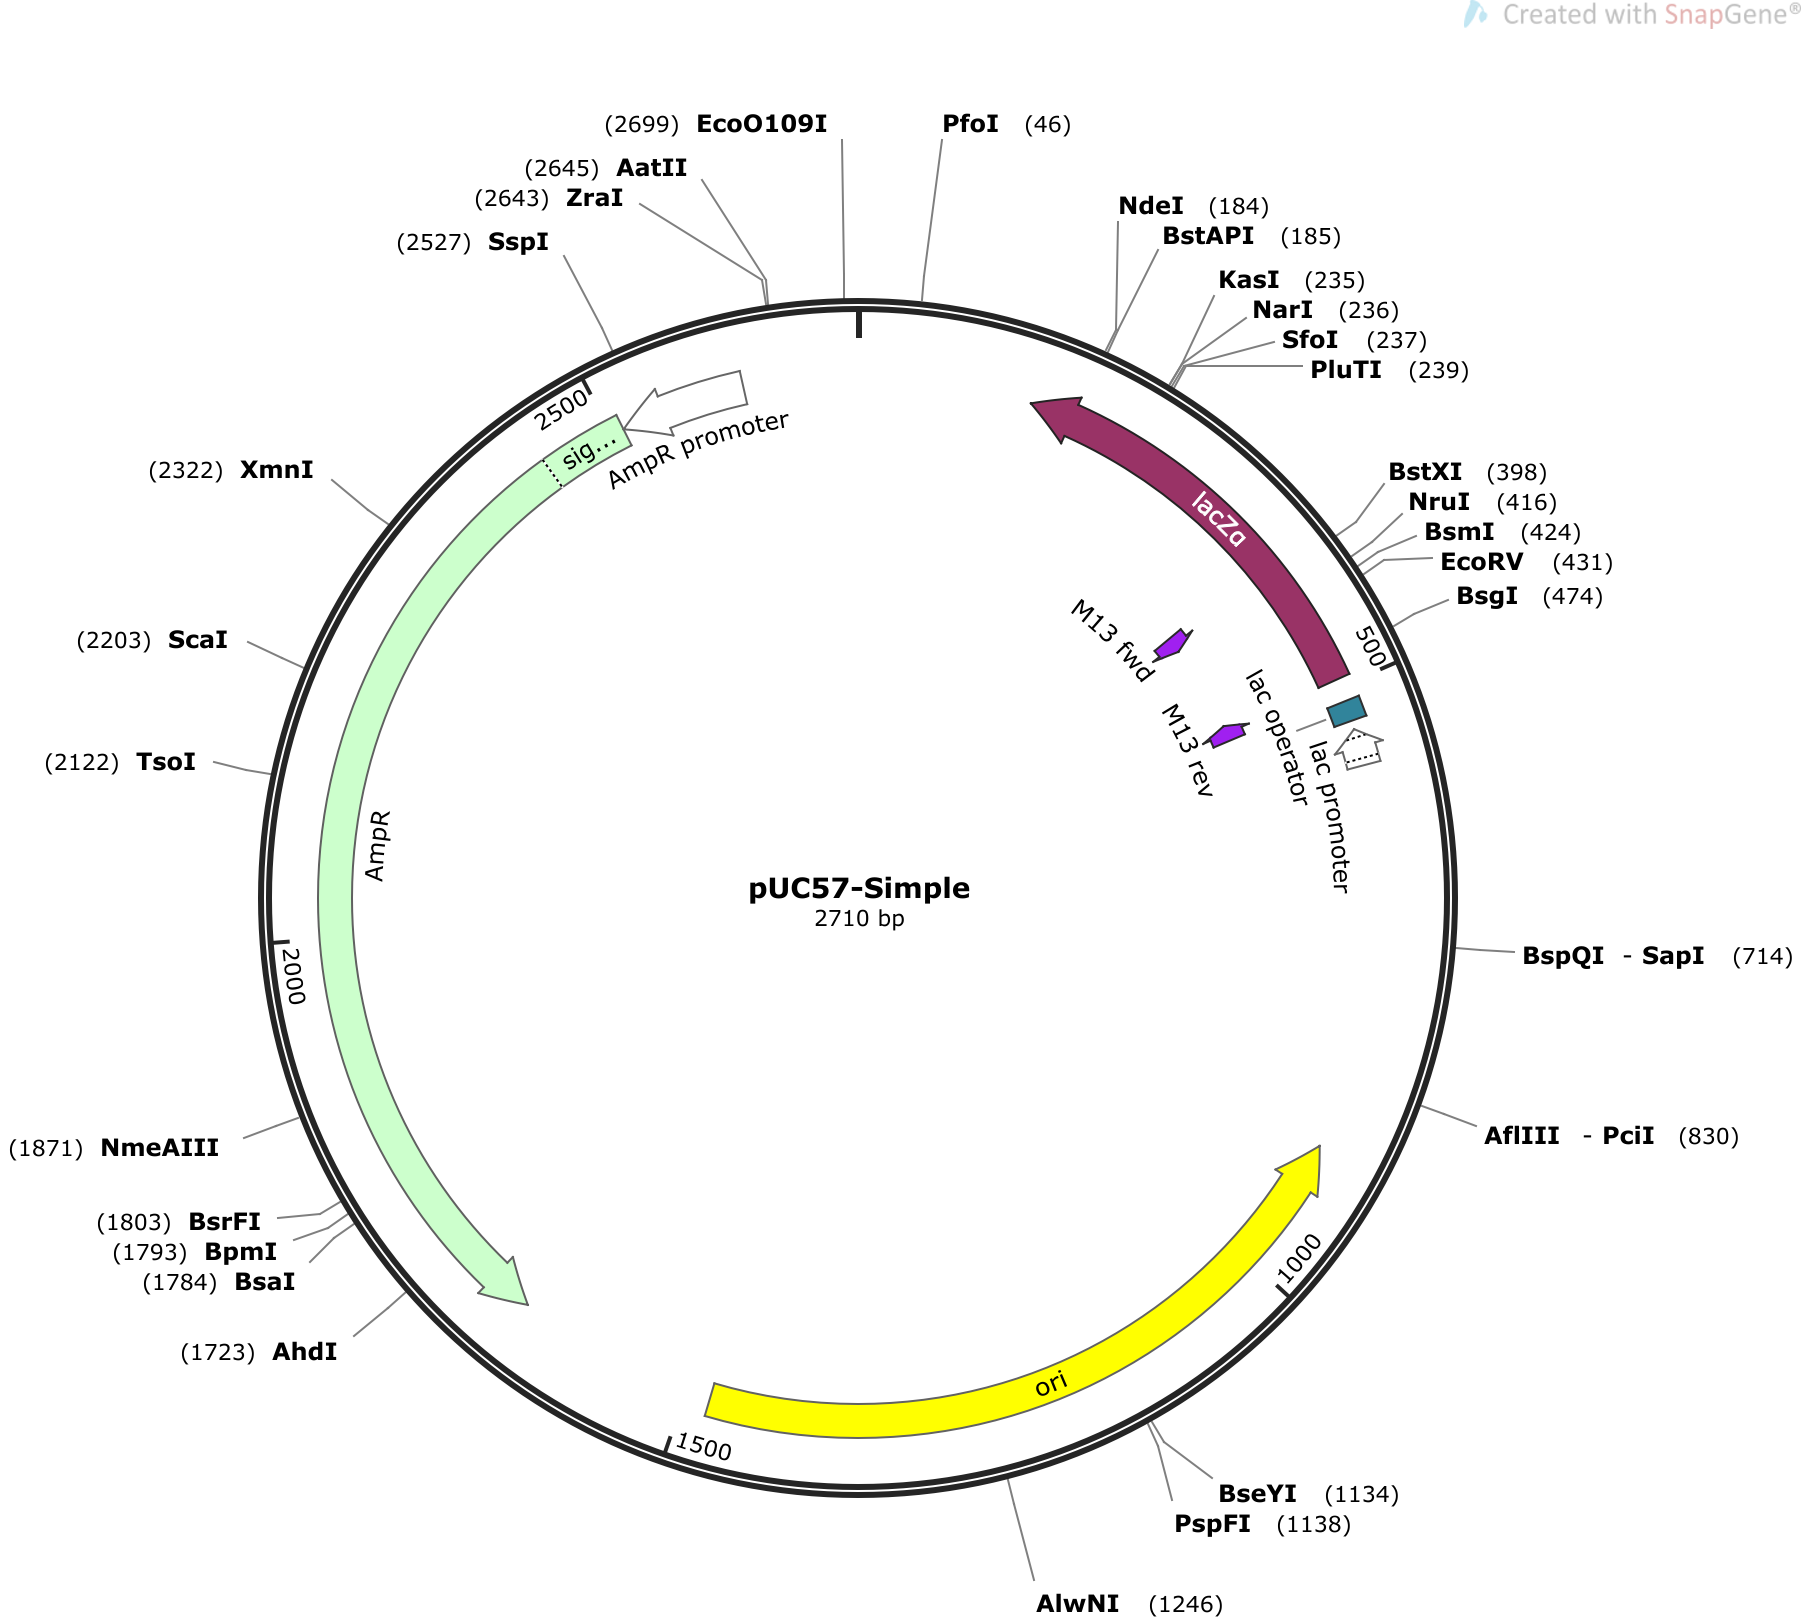
Tips for presenting your map. Use one of the provided graphics of the four possible plasmids for your plasmid figure. They are posted on the Lab 8 row of the D2L Main Page. To label the graphic of your restriction map, you can use a basic graphics editor such as Microsoft Paint (a standard utility on Windows OS) or Paintbrush (a free utility for Mac OS). Alternatively, you can print the provided graphics, label the numbering by hand, and scan the image. Microsoft Lens is a free app that creates clean jpeg images that do not have the shading problems of a photo taken with your camera app. If you use Lens for this purpose, select save to "Gallery" rather than PDF and you will find the image in the default photo gallery of your device.
For reference, below is an example of a plasmid map with restriction sites and nucleotide positions labeled. Because this image was generated from sequence data rather than gel data, the sequence positions are exact. Your position labels will have much less precision and may have ambiguities due to inconsistencies of lengths for the same fragment from multiple lanes. Do the best you can with the data you have. It is acceptable for your position labels have 50% variance from the correct values.