Writing Assignment 2
Lecture Video
This week, you will write (1) a formal Experimental method, (2) present your Results , and (3) present the calculations you did this week in an Excel spreadsheet. Please consult the above links to the Writing Guidelines and the Grading Rubric on the D2L main page before you begin writing. Give each of the two sections titles.
Experimental
- Even if you are presenting only one method, you should always give the method a clear subtitle. In this case, Tyrosinase kinetics measurements is a suitable subtitle.
- Describe the Tyrosinase kinetics procedure in fewer than 250 words with the minimum critical detail required for someone to replicate your work. This is a writing practice exercise, not a complete Methods section. For this reason, you are not required to write-up the dissection and extraction procedures.
- Examples: Consult the literature examples in the Appendix below for the level of detail expected for an enzyme kinetics procedure.
- Required Details: The rubric for this assignment (on D2L) lists the details expected in this Experimental section.
- Your method must also use one or more equations to explain how to convert the slope of absorbance change over time into relative activity. Equations are recommended for defining your enzyme units (U) and relative activity (U/mL).
- Follow the equation format standards from Appendix A (Data Presentation) in the Writing Guidelines.
- Appendix E (Tips) in the Writing Guidelines contains extremely useful advice on how to save time when using Microsoft Equation Editor.
- Style: Consult the course Writing Guidelines for the stylistic standards of an Experimental section.
Results
- Follow the guidleines below to generate a figure and table that meets professional standards for publication.
- Figure 1 should be a plot of representative raw kinetics data.
- The purpose of this graph is to present demonstrate the quality of your raw kinetics data and whether or not addition of SDS affects this quality.
- If the rate slows down at later times, this indicates that the later time points do not represent initial rates and should be excluded. If this was the case, comment on this.
- If the linear trendline gives an R-squared close to 1, then very little noise contributed to the data and it is more precise than noisy data.
- Generate a scatter plot with linear trendline for two sets of data, one run without SDS and one run with SDS.
- You do not need to plot all six to ten samples, but you are permitted to do so if you are able to make an informative, uncluttered figure.
- If each of your runs was so different that no one sample was typical, then plot all of your data.
- Data Analysis steps 1 - 2 explain how to process your data to generate this figure.
- The plot should look similar to Figure 2 in the Enzyme Assays Background.
- Consult Figure Format section of the Writing Guidelines for the standards of a good figure.
- Consult Writing Guidelines Appendix B (Captions-Methods) for the expected details of an Enzyme kinetics caption.
- Table 1 will summarize your kinetics results.
- Include the relative rates (U/mL of extract) from all of your enzyme assays, both with and without SDS, in units of U/mL.
- Also include the average and standard deviation for each set of replicate samples.
- Tip: Create and format Table 1 in Excel, then copy and paste it to your Assignment.
- The title and labels should meet the Table Format standards described in the course Writing Guidelines.
- Write a paragraph that describes the results in Figure 1 and Table 1 and comments on their quality. Comment on the R2 values in Figure 1 and standard deviations in Table 1. Consult the Results And Discussion page of the Writing Guidelines for specific information on how these statistical parameters contribute to an assessment of the quality of data.
- No discussion is required because you will only have enough data and context to write the discussion for this work after lab 4.
Submit by next lab meeting
- Your Excel spreadsheet demonstrating the conversions of AU/sec to AU/min to M/min to U to U/mL for your actual data. These calculations should be clearly organized and labeled. Highlight an example of a cell that performs each requested calculation in yellow to make it easier to grade.
- A printed copy of Writing Assignment 2 with the Rubric stapled to the top.
- A digital copy of Writing Assignment 2 to the Submissions folder.
Post your data online
- Either you or your partner must post your mean relative activity results (with and without SDS), your mass of mushroom used, and total buffer used to your section's data spreadsheet at least one hour before the start of your next lab.
- The link to your section's data spreadsheet is in a table on the D2L Main Page (below the schedule grid). The spreadsheet is powered by Google Docs and automatically saves your changes.
Appendix: Literature Models for Writing Experimental Methods
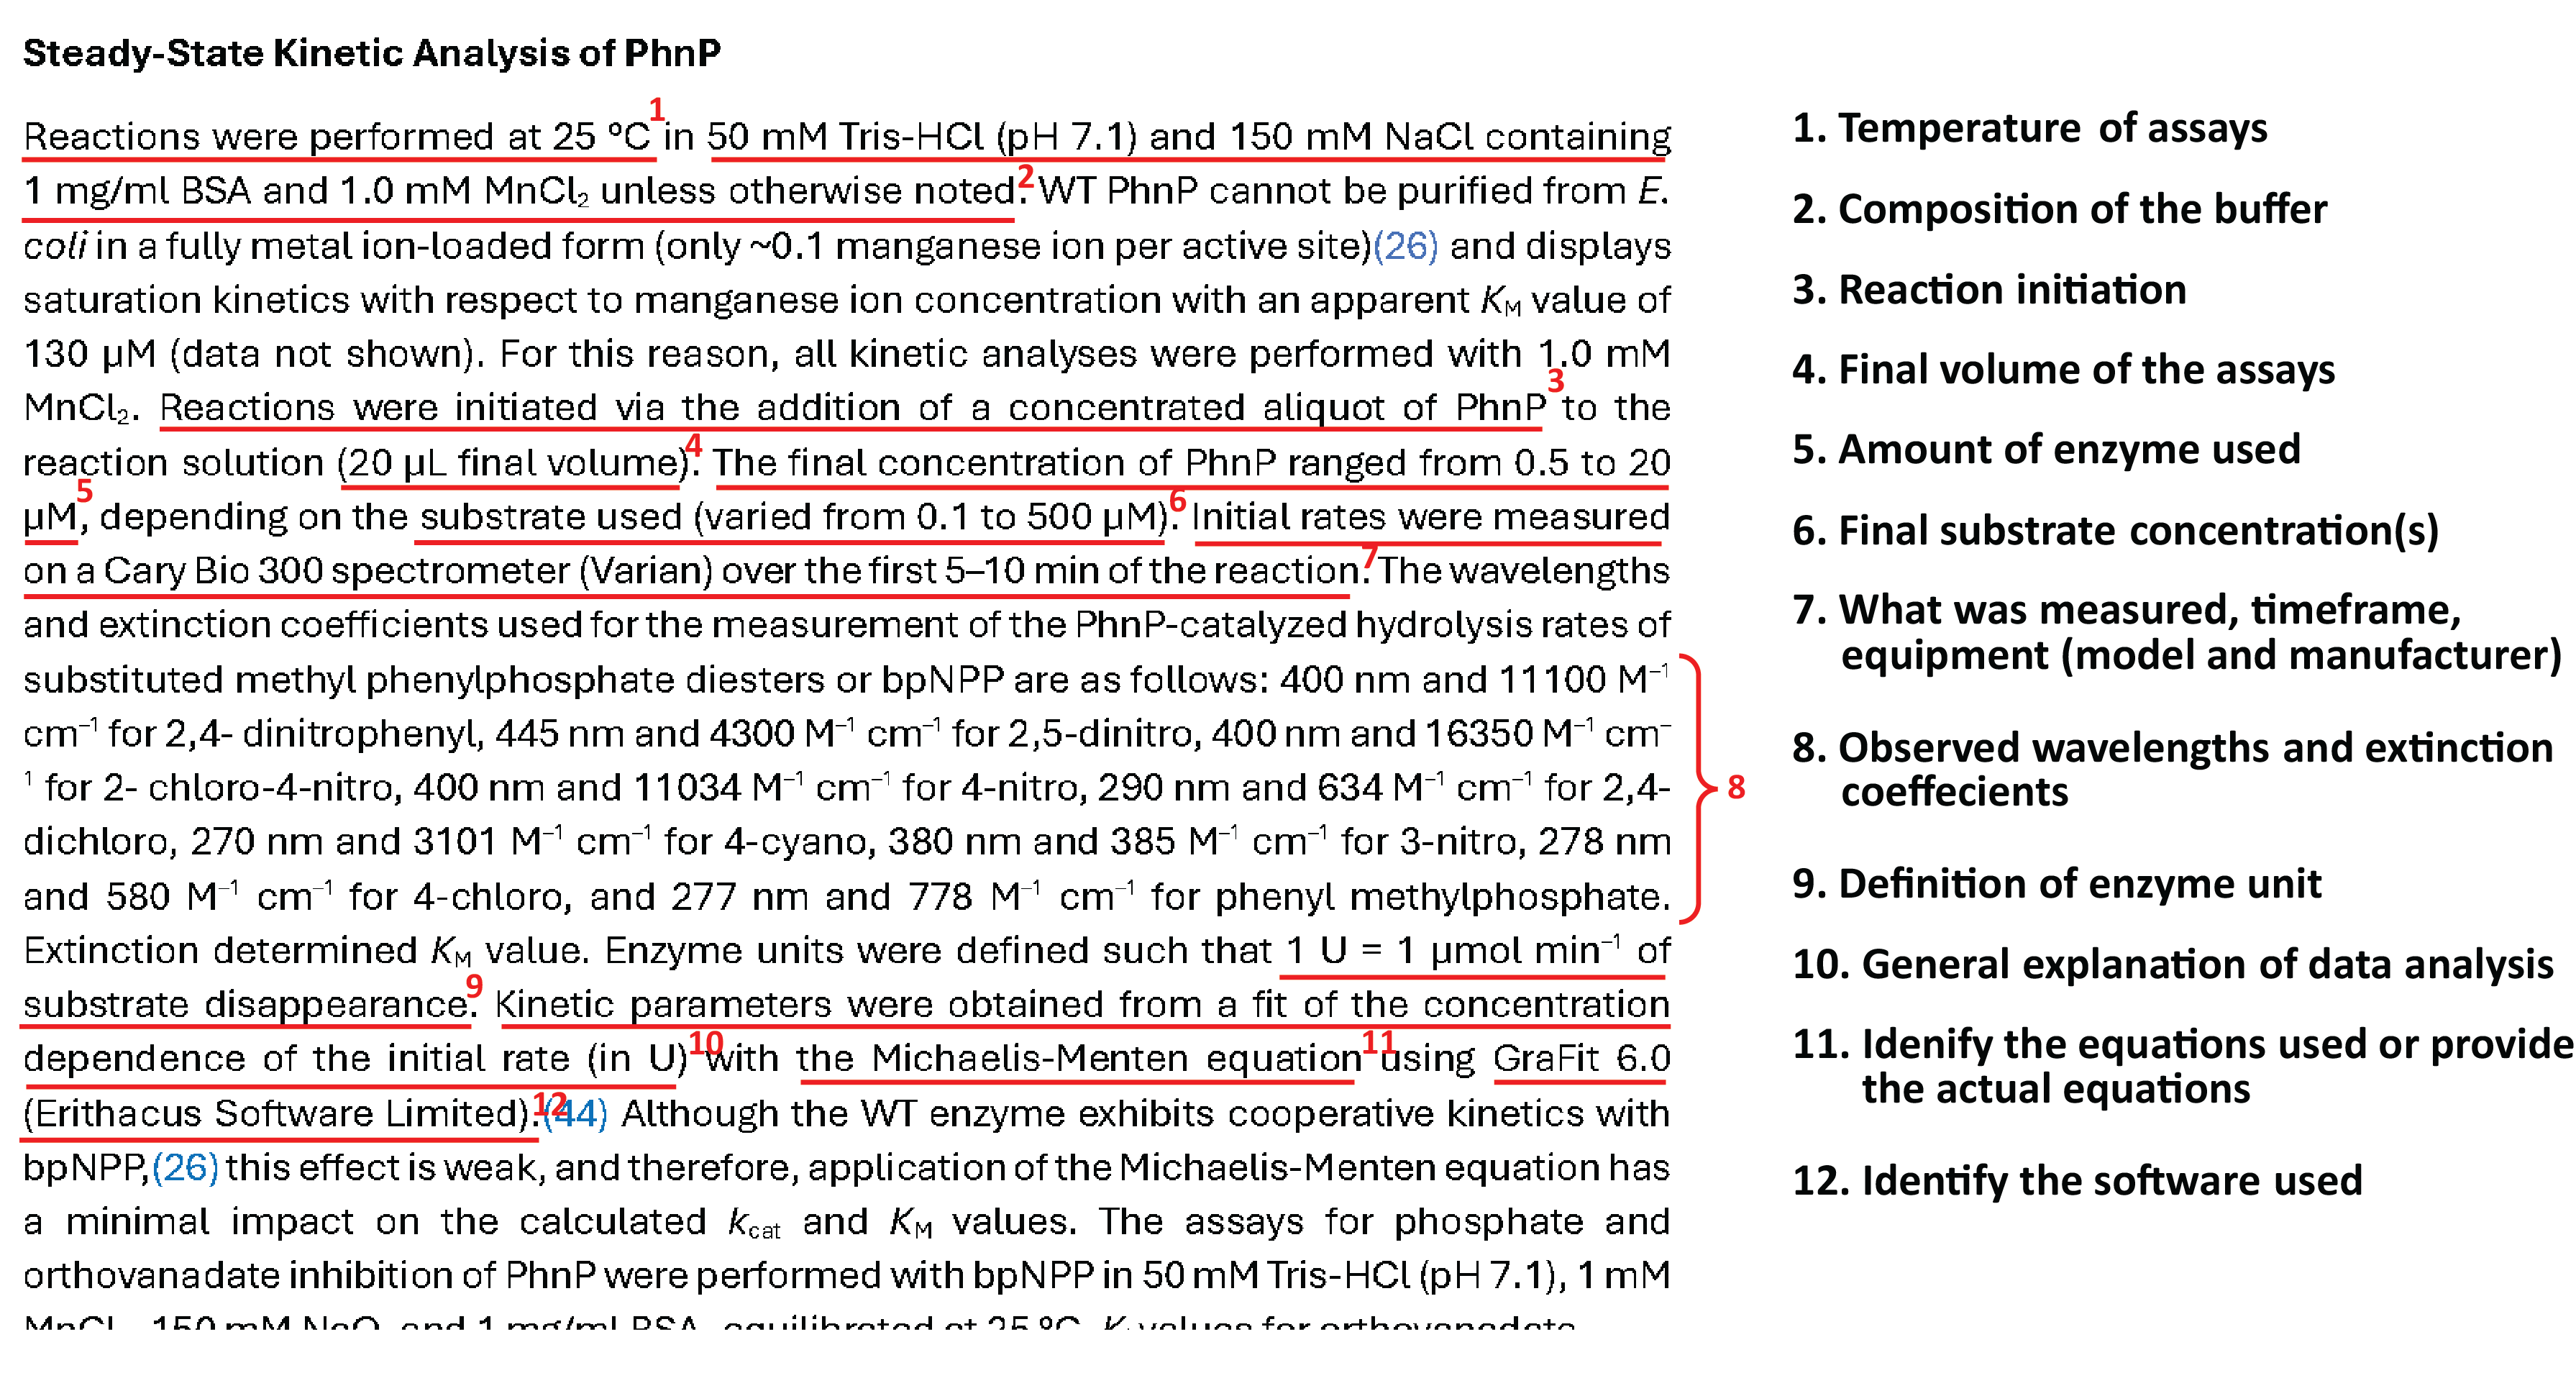
The following is a typical example of an enzyme kinetics method from the journal Biochemistry. The essentail details required for reporting an enzyme kinetics method are underlined in red with a legend in the right margin.
The following is a tyrosinase extraction procedure taken from the literature.14 Although you are not writing such a procedure, this example illustrates how brief a publication quality method can be while still being complete.
