Data Analysis
Overview. Organize your data to analyze each kinetics assay trial separately. Do not pool the results of different assays. We are interested in the reaction rate, which is expressed by the slope of the linear data early in the reaction time course. Since each assay was an independent measurement, we must plot each trial separately, discard later time points that deviate from linearity as the reaction naturally slowed-down, and then determine their slopes. We will then convert each slope into a relative activity. Only after we have replicate values of relative activity will we take the mean and deviation of replicates as the last step.
 1. Organize your data and calculations in Exce, keeping in mind that that your Excel spreadsheet will be graded as part of Assignment 2. Include clear labels and headings. Points will be deducted if your spreadsheet is disorganized and it is difficult to find the required information. The Assignment rubric lists the Excel requirements.
2. Make a plot relating absorbance and time (the independent variable of time should be on the x-axis) for each of your assay trials. Depending on what is clear and easy for you to compare, you can either plot them all together, generate a separate plot for each assay, or combine the data with and without SDS as two separate plots (my personal preference). Plot a trendline for each separate trial. Examine each plots and exclude data points from the trendline that deviate significantly from linearity at later time points. Note this in your report.
A scientist should always justify excluding data. Since we are measuring initial rates, we should only analyze the early linear time points. We are therefore justified in excluding late time points that reflect a slowing reaction.
Next, generate a separate scatter plot of two representative data sets, one with and one without SDS. Fit linear trend lines. Delete all gridlines, titles, legends, and trend line equations to use this plots in Figure 1 in the Lab 2 assignment. The Writing Guidelines contain an example of a well-formatted plot in a figure.
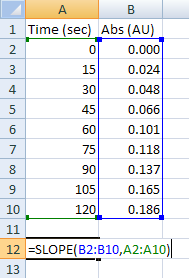
3. Calculate your reaction rates with the SLOPE function, =SLOPE(y_values,x_values). Highlight your absorbance data as "y-values" and your time points as "x-values." Using SLOPE gives you higher-quality parameters than the defaults for the trend line equation generated on the graphs. In the example at right, the SLOPE function returns 0.0015522. By default, the slope of the equation on the graph is 0.0016. Attempt to replicate this result by entering the data at right.
Perform the same steps to calculate the y-intercept, =INTERCEPT(y_values,x_values), and the R-squared, =RSQ(y_values,x_values), for the trendline equation and coefficient of determination that you will present in the caption of your figure.
4. Using Excel, perform the calculations to convert your reaction rate slopes from absorbance change at 475 nm (ΔA475) in units of sec-1 to relative activity in units of U/mL by using Beer's Law (A = εlc). Note that absorbance in unitless by definition. Below, I work through the calculations using our data from the above example.
First, convert seconds to minutes and ΔA475 to μmol of dopachrome. The former conversion is simple dimensional analysis:
$$ \textit{Reaction rate } ( \text{min}^{-1} )= \left( \frac{\Delta A_{475}}{\Delta \textit{time} \ ( \text{sec} ) } \right) \left( \frac{60\ \text{sec}}{1\ \text{min}} \right) $$This gives us change in absorbance at 475 nm per change in time. In our example above, 0.0016 sec-1 gives us 0.096 min-1.
The later conversion use Beer's Law (c = A/εl) to transform absorbance into concentration units. The published molar extinction coefficient for dopachrome at 475 nm is ε475 = 3.6 × 10³ M-1cm-1.
$$ \textit{Reaction rate} \ ( \text{M} \cdot \text{min}^{-1} ) = \left( \frac{\Delta A_{475}}{\Delta \textit{time}} \ ( \text{min}^{-1} ) \right) \left( \frac{1}{3600 \ \text{M}^{-1} \cdot \text{cm}^{-1}} \right) \left( \frac{1}{1.00\ \mathrm{cm}} \right) $$Using the data from our example, this gives us 2.7 × 10⁻⁵ M min-1. Reaction rates in biochemistry are often small, so we usually convert to more convenient units of micro- or nano-. Thus, the rate in our example is easier to deal with if we express it as 27 μM/min (multiply calculated factor by (106 μM)/(1 M)).
By definition, enzyme units (U) are expressed in μmol min-1. To convert molarity to moles, multiply by the total volume of the reaction:
$$ Activity \ ( \mathrm{U} ) = Activity \ ( \mathrm{μmol} \cdot \mathrm{min}^{-1} ) = \textit{Reaction rate } ( \mathrm{M} \cdot \mathrm{min}^{-1} ) \times Volume \ of \ reaction \ ( \mathrm{L} ) $$Multiplying by the total volume of your reaction gives activity in units of moles of dopachrome produced per minute. If in our example the volume of reaction was 4.0 ml (0.004 L), we would get 0.11 μmol/min or 0.11 U.
The more enzyme you add to your assay, the higher the activity you will measure. For this reason, biochemists often use relative activity(the activity per volume) as a proxy for enzyme concentration. Relative activity (in U/ml) of your extract is calculated as
$$ \textit{Relative activity} \ (\mathrm{U} \cdot \mathrm{mL}^{-1} ) = \frac{ \textit{Activity in tube} \ ( \mathrm{U} ) }{ \textit{Volume of extract added to assay } ( \mathrm{mL} ) } $$For example, if we had added 10 μL of mushroom extract to our 4.0 mL reaction in our example, the relative activity is 11 U/mL. Of all of the ways that we have expressed of rate data thus far, only relative activity reveals something meaningful about our mushroom extract that can be compared from experiment to experiment. It tells us how many μmols of dopachrome is made in one minute by one mL of our extract. Report your relative activity in units of U/mL. If your values are significantly outside the range of 0.1—10 U/mL, you have most likely made a calculation error. Check your work before continuing.
5. Finally, calculate the mean of your replicates. To calculate the mean, use the AVERAGE function in Excel. To calculate the standard deviation, use the STDEV.S (or STDEV in older versions of Excel) function.
Worked example
Goal: Calculate Relative Activity (in U/ml) of undiluted extract.
Experimental Information:
- 1 Unit is defined as 1 μmol·min-1 for dopachrome formation
- 3600 M-1cm-1 is the dopachrome extinction coefficient
- 1.00 cm is the pathlength of the measurement
- 9.00 g is the total mass of mushroom used (not needed for this calculation)
- 30.0 mL is the total volume of extract isolated (not needed for this calculation)
- The crude extract was too active and would have required a volume that was too small to measure accurately, so 200 μL of extract was diluted to a final volume of 1000 μL.
- 10.0 μL is the volume of this diluted extract added to make the reaction in the cuvette
- 900 μL is the volume of reaction placed in the cuvette for measurement
- This diluted sample gave 0.100 AU·min-1 for the rate of dopachrome color formation
Step 1, calculate Units of activity in the cuvette:
First convert absorbance to concentration.
$$ \textit{Rate of dopachrome concentration change} = \frac{0.100 \ \text{min}^{-1}}{3600 \text{ M}^{-1}\text{cm}^{-1} \times 1.00 \text{ cm}} = \textcolor{blue}{\mathbf{2.77 \times 10^{-5} \text{ M}\cdot\text{min}^{-1}}} $$Since enzyme units (U) are defined as amount of chemical change (μmol·min-1) not concentration change (μM·min-1), you must next convert concentration to amount of activity by multiplying the volume of the reaction in the cuvette.
$$ \textit{Activity in cuvette } \mathrm{(U)} = \left(\textcolor{blue}{\mathbf{2.77 \times 10^{-5} \text{ mol}\cdot\text{L}^{-1}\cdot\text{min}^{-1}}}\right) \times \left(900 \times 10^{-6} \text{ L}\right) \times \left(10^{6} \text{ }\mu\text{mol/mol}\right) = 0.0249 \text{ }\mu\text{mol}\cdot\text{min}^{-1} = \textcolor{red}{\mathbf{0.0249 \text{ U}}} $$Step 2, calculate Units of activity in the extract:
Since the amount of activity in the cuvette came from a known volume of extract, divide this activity by the volume of extract.
$$ \textit{Relative Activity} = \frac{\textit{Activity in the cuvette } (\mathrm{U})}{\textit{Volume of extract in cuvette reaction } (\mathrm{U/mL})} = \frac{\textcolor{red}{\mathbf{0.0249 \text{ U}}}}{0.0100 \text{ mL}} = \textcolor{magenta}{\mathbf{2.50 \text{ U/mL}}} $$Step 3, calculate activity of the undiluted sample (if you made a dilution, this is optional):
$$ C_1 \times V_1 = C_2 \times V_2 $$ $$ (C_1) \times (200 \text{ }\mu\text{L of extract}) = \left(\textcolor{magenta}{\mathbf{2.50 \text{ U/mL}}}\right) \times (1000 \text{ }\mu\text{L final volume of diluted sample}) $$ $$ C_1 = \textcolor{green}{\mathbf{12.5 \text{ U/mL}}} $$Pro Tip: In the above dilution, the final sample measured was 1000 μL and it started as 200 μL. Since 1000/200 = 5, scientists will often refer to this as a 5× (pronounced "five-fold") dilution. The final volume divided by the initial volume is called the dilution factor.
$$ \textit{Dilution Factor} = \frac{V_{\text{final}}}{ V_{\text{initial}}} $$When we think about dilutions this way, to calculate the undiluted concentration we simply multiply by the dilution factor. Thus, an alternative way to calculate Step 3 is to first calculate the dilution factor from the information given, and then to multiply the diluted activity by the dilution factor.
$$ \textit{Dilution Factor} = \frac{V_{\text{final}}}{ V_{\text{initial}}} = \frac{1000 \text{ }\mu\text{L}}{200 \text{ }\mu\text{L}} = \textcolor{darkorange}{\mathbf{5.00}} \quad \text{(a 5 fold dilution)} $$ $$ \left(\textcolor{magenta}{\mathbf{2.50 \text{ U/mL}}}\right) \times \left(\textcolor{darkorange}{\mathbf{5.00}}\right) = \textcolor{darkgreen}{\mathbf{12.5 \text{ U/mL}}} $$