Materials
- Sodium phosphate buffer, 50 mM, pH 6.5
- Mushroom tyrosinase samples:
- The commercial tyrosinase sample is 0.1 mg/ml Agaricus bisporus tyrosinase (Sigma-Aldrich Corp.) dissolved in the same same buffer as above. It is apparently the purified dimer since the Sigma reports the molecular weight as: 128 kDa by sedimentation velocity diffusion; 133 kDa by light-scattering measurements, and 119.5 kDa by electrophoresis.
- You also have the option of using your own group's tyrosinase samples from Lab 2.
- 50 mM catechol in 50 mM phosphate buffer, pH 6.5
- 10% SDS solution in 50 mM phosphate buffer, pH 6.5
- Spectrophotometer set to 400 nm
- 1.5 mL cuvettes
- Pipettors and pipet tips
- Microcentrifuge tubes for assays and dilutions
|
Always keep your enzyme stock solution on ice to prevent loss of activity. Mix all all solutions by vortexing before you use them. |
Lecture Video
Part A: Determination of the enzyme concentration
Purpose
In Part A you will determine the enzyme concentration that you will use in Parts B and C. You will evaluate at least four concentrations of enzyme while holding catechol constant at a high concentration to find a volume that gives a fast, yet linear initial rate within the first minute for Vmax measurements. A good objective is an enzyme concentration that gives a rate of about 0.20 ΔA400·min-1 (you should observe ΔA400 ~ 0.2 at 60 seconds). Additionally, you will demonstrate that the relationship between enzyme concentration and initial rate is linear.
Methods
Prepare a table similar to Table 1 to keep track of the experimental conditions and calculations. Turn your notebook sideways to give yourself enough space for all the time points. The rightmost two-thirds of the page should be reserved for recording time. Leave enough space in your notebook to make three to four measurements.
The conditions for each sample should be a total volume of 1000 μL with 10 mM catechol, 0.1% SDS, and at least three different volumes of enzyme. The catechol stock solution should be 50.0 mM (it may be slightly different on day of lab) and the SDS stock solution will be 10.0%. Refer to your notes lab 2 to estimate a good starting volume of enzyme to use. Measure the rate as an increase in absorbance at 400 nm every 10 seconds, just as you did in Lab 2. Remember to add the enzyme last, mix, and start your stopwatch as soon as you zero the spectrometer.
Table 1. Suggested data table format for keeping track of your experiment conditions.a
|
sample |
[catechol] |
[catechol] |
catechol |
SDS |
enzyme |
buffer |
A400 |
10 sec |
20 |
30 |
out to 120 |
|
A |
50 |
10 |
200 |
10 |
15b |
775b |
|
|
|
||
|
B |
50 |
10 |
200 |
10 |
20b |
770b |
|
|
|
|
|
|
|
|
|
|
|
|
|
|
|
|
|
|
|
|
|
|
|
|
|
|
|
|
|
|
|
a. Turn your notebook sideways and copy this table with the headings across the long edge to fitt all the time points. Dedicate a full notebook page for all of this week's data.
b. These sample values demonstrate how to use the table to help you plan. In Part A you will vary the volumes of enzyme and buffer with each run in an effort to find a rate that is about ΔA400·min-1 = 0.20–0.25.
Part B: Estimation of Km to determine the catechol concentration range for Part C
Purpose
In Part B, you will run a few assays using a broad range of substrate concentrations to estimate Km using the Direct Linear method. You will then use your approximation of Km to calculate V1, the volume of catechol you will use in every reaction in Part C.
Methods
Prepare a table similar to Table 1 to keep track of the experimental conditions and calculations. Plan to make three measurements. For this part, each sample will contain 0.1% SDS, your chosen volume of enzyme (from Part A), and variable catechol concentrations. We recommend that you add catechol volumes of 100 μL, 30 μL and 10 μL with a final assay volume of 1000 μL. The final catechol concentrations will be 5.0 mM, 1.5 mM and 0.5 mM respectively. Measure the initial rates for these reactions at 400 nm.
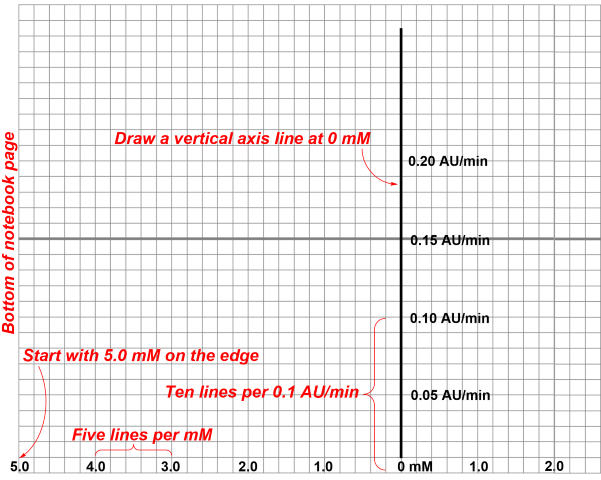 1. In your notebook or on graph paper, create a Direct Linear plot to estimate Km as shown at right. Use the full page!
2. For the first assay in your table, place a point at coordinates -[S] (x-axis) and vo (y-axis). Estimate vo in units of AU/min by subtracting the absorbance at 0 seconds from the absorbance at 60 seconds.
3. Draw a line to connect these two points and extrapolate the line so that it extends to the edge of the x>0 y>0 quadrant as in Figure 3.
4. Do the same for the remaining assays. You should have 3 lines on your plot. The three lines should intersect at a single point in the x>0 y>0 quadrant. Use this point of intersection to estimate the value of Km on the x-axis, as shown in the Figure 3. If your lines do not intersect, prepare one more assay at any catechol concentration of your choice. One of your trials may be an obvious outlier.
5. Multiply your estimated Km by 160 μL·mM-1 to calculate V1, the catechol concentration that you will use in Part C. For example, if your estimated Km was 1.1 mM, then 160 μL·mM-1 × Km is 176 μL. I usually round-up to the nearest 10 μL for convenience (e.g. 180 μL). The reasoning behind this calculation will be explained in the Part C procedure.
Part C: Careful estimation of Km and Vmax
Purpose
In Part C, you will finally proceed with the actual experiment, monitoring the tyrosinase rate as a function of substrate concentration.
Additional Background
To make precise and accurate measurements of Km and Vmax, you will need precisely known concentrations of catechol substrate that spans at least two orders of magnitude from about one-tenth of Km to about ten times Km. Our pipettors are not accurate enough to make a series spanning such a range if we use the approach that we have previously used for BSA in our protein assays. However, since our pipettors can consistently dispense the same volume at the upper end of their capacity, we can use the technique of serial dilutions to attain the necessary level of precision and accuracy for Part C.
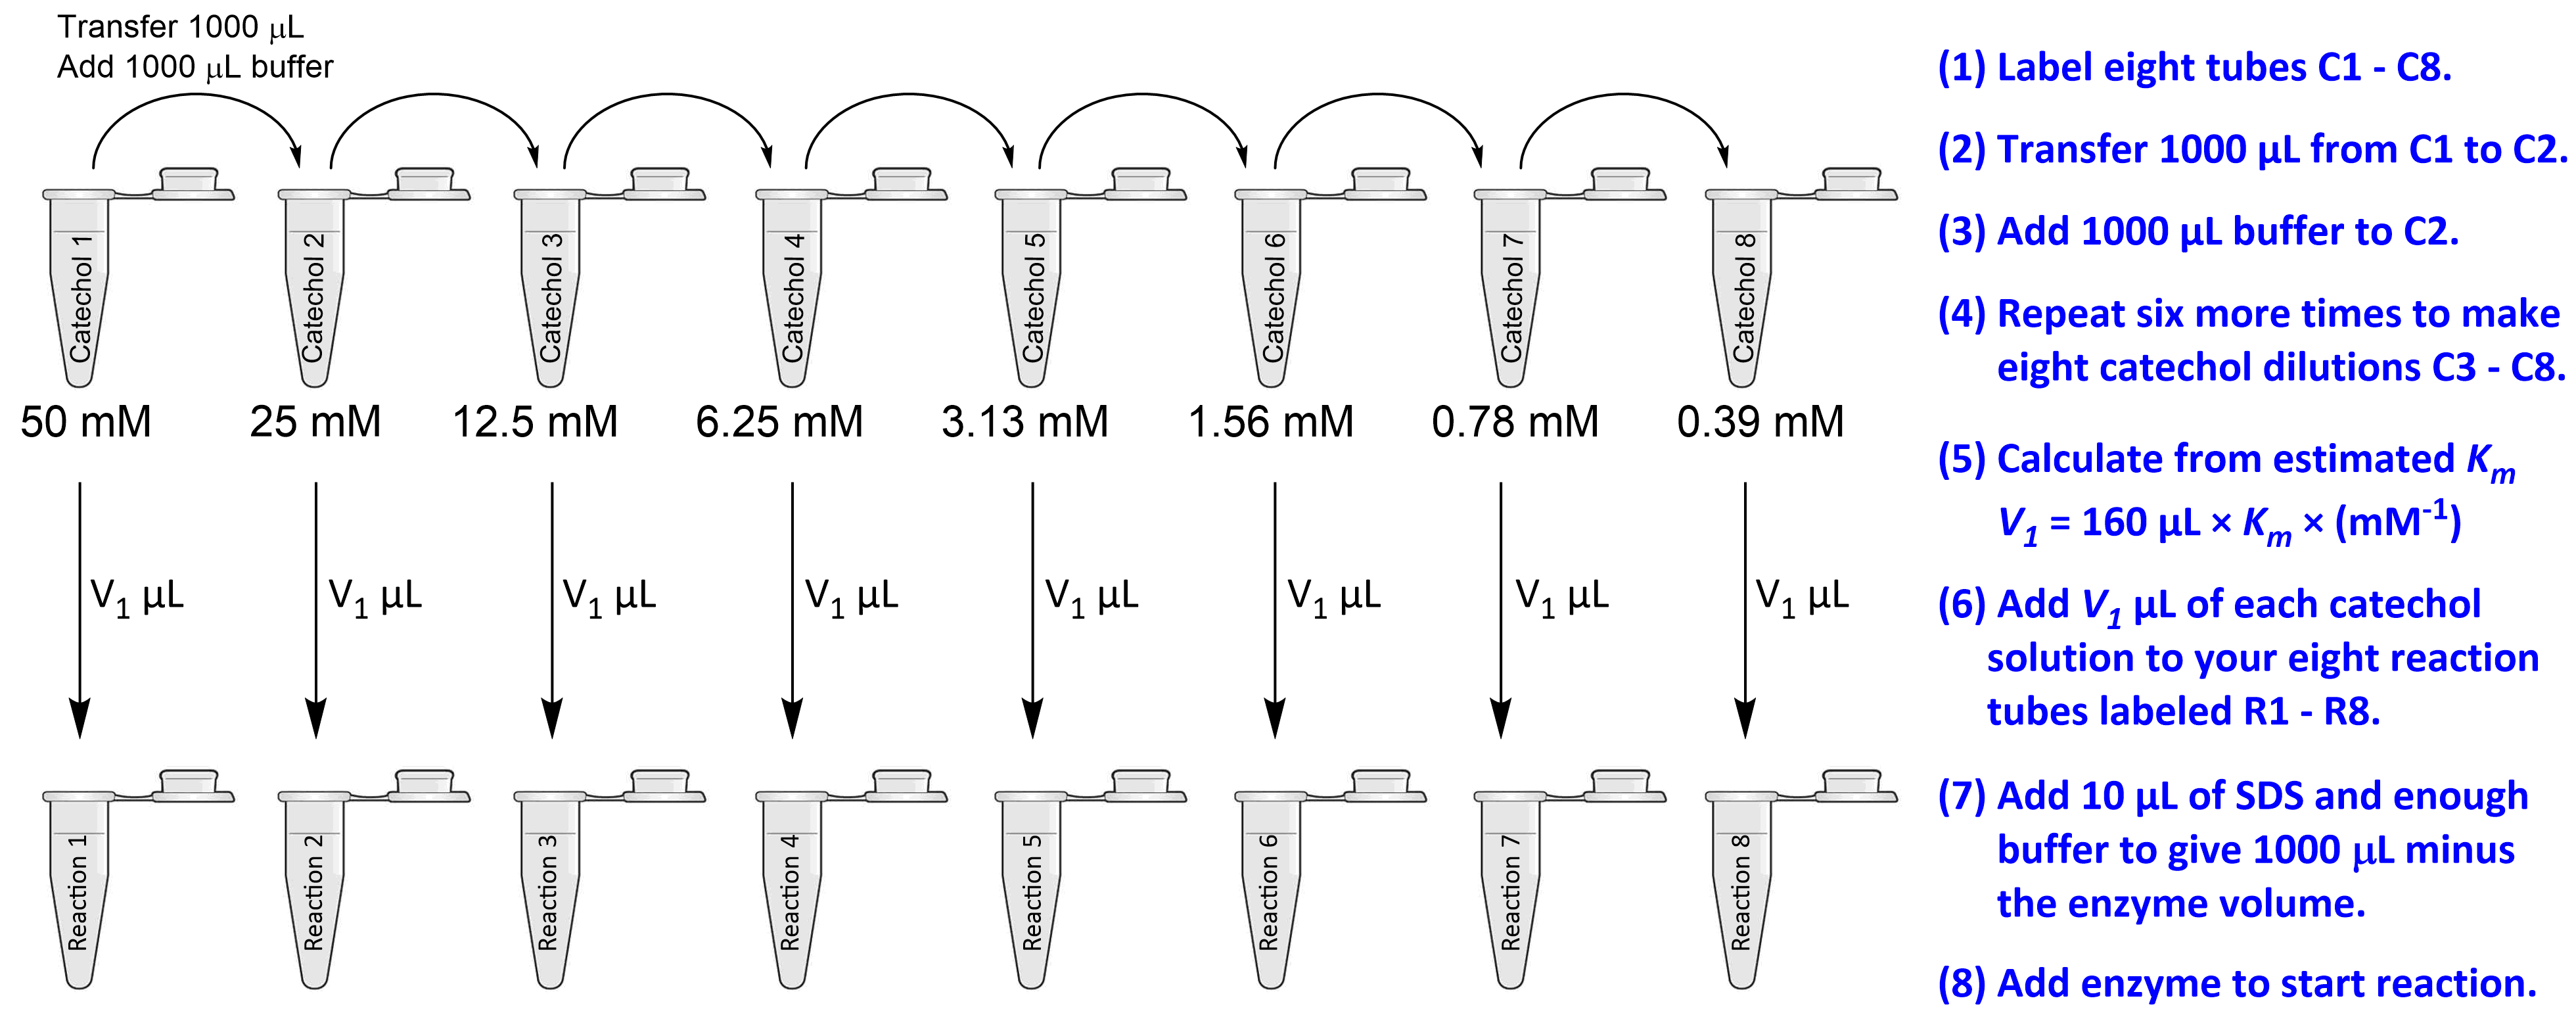
We will use eight two-fold serial dilutions to span the required range. Starting with the a tube of 50.0 mM catechol stock solution, if you transfer a fixed volume into an empty tube, and add the same volume of buffer without adjusting the setting of the pipettor, the resulting solution will be precisely 25.0 mM (a two-fold dilution). After repeating this several more times without adjusting the pipettor, the eighth solution will be 128 times more dilute than the first solution with greater accuracy and precision than is attainable with pipettors by other dilution methods (steps 1–4 in Figure 1).
The catechol concentration in your assays will be dependent on the volume you transfer from the eight serial dilution tubes. You calculated this volume, V1, in Part B. The equation you used simply set the highest catechol concentration to eight times Km, thus satisfying the criteria that our catechol concentration range be at least two orders of magnitude from about one-tenth of Km to about ten times Km. To derive the equation from Part B, start with the dilution equation
$$C_1 \times V_1 = C_2 \times V_2 \tag{4}$$
Next, enter the values for the stock concentration (C1 = 50.0 mM), final assay volume (V2 = 1000 μL), and diluted concentration (C2 = 8 × Km),
$$(50\ \text{mM}) \times V_1 = (8 \times K_m) \times (1000\ \text{μL}) \tag{5}$$
Solve for V1 to obtain
$$V_1 = (160\ \text{μL}) \cdot \text{mM}^{-1} \times K_m \tag{6}$$
V1 is the constant volume that you will transfer from the eight catechol dilutions into each assay.
Methods
In this part, every assay will contain the volume of enzyme selected in Part A, the catechol volume calculated in Part B (V1), 10 μL of 10% SDS, and enough buffer for a final volume of 1000 μL.
1. Prepare eight two-fold serial dilutions in 2.0 mL microcentrifuge tubes. To do this, fill the first tube with 50 mM catechol stock solution, then transfer 1000 μL into the next tube. Without changing the setting of the pipettor, add 1000 μL of buffer and mix. Then, without changing the setting on the pipettor, transfer 1000 μL of that solution into the next tube. Add 1000 μL of buffer, mix, and repeat until you have eight solutions.
2. Transfer volume (V1) from your eight catechol dilutions to eight empty labeled reaction tubes (Step 6 in Figure 1).
3. To each of these reaction tubes, add 10 μL of 10% SDS and the appropriate amount of buffer to give you a 1000 μL reaction after you add your Part A volume of enzyme.
4. Add enzyme to a reaction tube to start the reaction.
5. Measure the initial rates for these concentrations as before.
6. Repeat for your other seven samples.
Note: the reactions with the lowest catechol concentrations may be very slow. You may wish to collect more time points for these if you see only a very small change after two minutes.