What are Vmax and Km?
Lecture Video
The scheme below shows the elementary process for an enzymatic reaction. Enzyme (E) and substrate (S) bind to form an ES complex. There is a rate of binding and a rate of release given a k1 and k-1, the ratio k1/k-1 defines the equilibrium constant K for substrate binding.
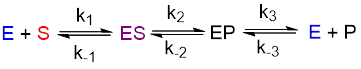
In the next step, the enzyme catalyzes conversion of ES to EP, the enzyme-product complex. This also has a forward and reverse rate, and an associated equilibrium constant. Finally, enzyme and product (P) are released in the final step. Like the previous two steps, this one is also reversible.
If we could measure the six constants above while changing a parameter such as pH, inhibitor, or SDS concentration, we would discover the effect that these parameters have on the enzyme mechanism by observing which of the constant(s) changed the most. For example, if SDS caused k1 and k-1 to change, but k2, k-2, k3, and k-3 did not change by much, then we could propose that SDS changes the structure of the enzyme to permit tighter substrate binding and this structural change has no effect on catalysis (the k2 and k-2, step) or product release (the k3 and k-3 step).
Unfortunately, it is not possible to measure these six constants in a simple routine way. Instead, biochemists use assumptions to reduce the complexity of this system. The slowest steps of a process contribute most to the overall rate because they are bottlenecks in the process. For example, once you board a plane in Chicago, the steps to get to St. Louis take one hour. However, the steps to drive to the airport and get to your plane may take three hours. The slow steps of getting to the plane have the greatest influence over the journey time. We can divide the journey into two phases, getting to the plane and getting to St. Louis.
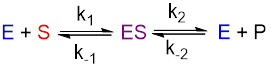
By analogy, we can treat the later steps catalysis and product release as one step by assuming that one aspect of this two-step process is so fast that it does not contribute much to the rate. Then the equation simplifies to two steps with four constants (below).
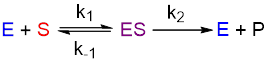
Next, if you measure initial rates only, you can assume that the reaction is irreversible because not enough product will accumulate during your measurement to allow the k2/k-2 reaction to equilibrate. With this second assumption, the equation simplifies to three constants (below).
When you study a two-step process like that described by the equation above, you find that the relationship between substrate concentration and initial rate changes. At low substrate concentrations, the initial rate varies linearly (vo = k'[S]). Such a relationship is known as first order kinetics. At high substrate concentration, the initial rate becomes approximately constant (vo = k"), independent of increases in substrate concentration. You can see these extremes in the figure below.
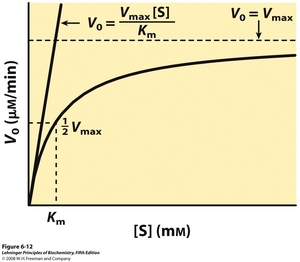 The maximum rate at high substrate concentration is a parameter known as Vmax. So at high [S],
$$v_o = k_{release} = V_{max} \tag{1}$$
This kinetic model is shown as a dotted line in the figure. At these conditions, the primary contribution to the rate is k2. Some researchers call the measured constant krelease because it describes the rate of release of product from the ES complex. In our airplane analogy, formation of the ES complex is stepping foot on the plane.
At low [S],
$$v_o = k_{capture}[S] = \frac{V_{max}}{K_m}[S] \tag{2}$$
This kinetic model is shown as a solid straight line in the figure. At low [S], the primary contribution to the rate is the rate of formation of the ES complex, which has a linear dependence on substrate concentration. Some researchers call this measured first-order rate constant kcapture because it describes the capture of substrate into the ES complex. For historic reasons, this term is most commonly called Vmax/Km. It is a kinetic constant in its own right, but it is somewhat confusingly referred to as a ratio of Vmax and a term known as Km , the Michaelis constant. The Michaelis constant corresponds to the substrate concentration at which the rate of substrate capture and product release contribute equally to the overall rate. It is approximately equal to the binding constant for the substrate but typically includes a contribution from k2, the disappearance of the ES complex1. Due to stickiness of either the product or substrate, Km is usually either smaller or larger than the binding constant of substrate respectively2.
Because we are not able to directly measure k1, k-1, and k2, we generally measure Vmax and Km which are made-up of these constants. The exact meaning of Vmax and Km in terms of the three constants varies from enzyme to enzyme. Boyer defines them in terms of the steady state assumption, however assumption is not always true for all enzymes under all reaction conditions. What is always true are (1) the definitions of these constants in terms of capture into and release from the ES complex and (2) the fact that the value of Km is always the substrate concentration at the rate of $\frac{1}{2}V_{max}$ (see figure above). The parameter Vmax is dependent on the amount of active enzyme present, which we cannot accurately determine in our sample. However, the parameter Km is independent of enzyme quantity and is thus suitable for comparison between groups and the literature.
Why do scientists measure these parameters? Generally, we are interested in observing how these apparent parameters change with respect to some variable, such as pH, different substrates, different inhibitor concentrations, etc. Such studies are how biochemists discover the way that enzymes and inhibitors work. You will learn more about this next week
Estimating Michaelis-Menten Parameters from Data
Lecture Video
The relationship between substrate and initial rate is a hyperbolic one expressed by the Michaelis-Menten equation (3).
$$v_o = \frac{V_{max}[S]}{K_m+[S]} \tag{3}$$
At low [S] and high [S], the equation simplifies to the extremes described previously.
Modern scientists estimate kinetics parameters from experimental kinetics data using non-linear regression. A non-linear regression fitting program simply plugs values for unknown constants (such as Vmax and Km) directly into an equation, until it finds values that generate a curve that best fits the experimental data. Such an approach always gives highest quality, least biased estimates for unknown constants. Non-linear regression is a common feature in most scientific data analysis software packages (e.g. Origin, GraphPad Prism, MATLAB, NLREG, and IGOR) and free utilities such as DynaFit (www.biokin.com). However, this lab will make use of the classic and still widely used method of linear transformation to make parameter estimates using ubiquitous and familiar spreadsheet programs such as Excel.
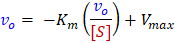
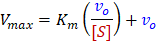
The classic expression of the Michaelis-Menten equation (3) can be rearranged into various linear (i.e. $y = mx + b$) forms:
| Type of plot | Linear expression | x-intercept | y-intercept | Slope |
|
Lineweaver-Burk |
|
-1/Km |
1/Vmax |
Km/Vmax |
|
Eadie-Hofstee |
|
Vmax/Km |
Vmax |
-Km |
|
Direct Linear |
|
-[S] |
vo |
vo/[S] |
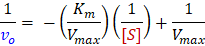
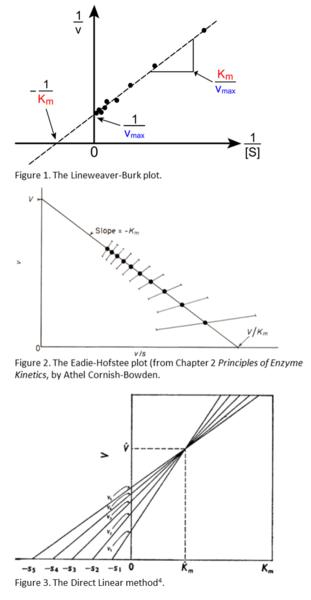 Each of these linear forms have different uses. The first method, the Lineweaver-Burk, or double-reciprocal, plot is the most common linear transform used to illustrate enzyme kinetics trends. By plotting the reciprocal of your rate measurements (vo) against the reciprocal of [S], you can calculate the constants Km and Vmax from the reciprocals of the x- and y-intercepts. One major disadvantage of this plot is that data points for high [S] are compressed and those for low [S] are spread-out. This biases the low concentration data, which generally has a larger percent error. Lineweaver-Burk is never recommended for determination of kinetics parameters from real data. Despite this, for reasons of tradition, Lineweaver-Burk plots are still commonly used to display the quality of data and for discussions of enzyme inhibition.
For determination of kinetics parameters, the Eadie-Hofstee plot is most recommended linear method. A major advantage of the Eadie-Hofstee method is that it does not take the reciprocal of the measured rates. This is particularly important because the error in substrate concentration is usually significantly smaller than the error in rate3. The Eadie-Hofstee method also uses direct values for vo on both axes, thus all of your measurements are given equal weight in the linear fit. Furthermore, the two primary kinetics parameters Vmax/Km (kcapture) and Vmax (krelease) can be directly read-off as the x- and y- intercepts respectively. As is its true nature, Km is calculated as the ratio of these two parameters.
Another common linear transformation of the Michaelis-Menten equation is the Direct Linear plot, also known as the Eisenthal and Cornish-Bowden method4. The advantage of this method is that the analysis is entirely graphical, it requires no math whatsoever! The Michaelis-Menten equation is rearranged such that both [S] and vo are on the same side of the equation. As a result, the x- and y- intercepts are always -[S] and vo. Therefore, by plotting all of your concentrations on the negative x-axis and all of your rates on the y-axis and then connecting the points with a line, your lines will always intersect at the x,y coordinates of Km, Vmax (see Figure 3). It is common to use this method to make sure that you are getting good results as you acquire them. It is generally recommended that you should acquire at least four data points with substrate concentrations that are below Km and about four above Km. The problem is that you need to know Km to choose your concentrations! However, you can get a good estimate of Km in lab by simply plotting [S] and vo in your notebook on the x- and y- axes as shown at right, drawing lines through the points, and then reading Km from the intersection of your lines projected onto the x-axis. After doing this, you can leave the lab confident that you have a good dataset.
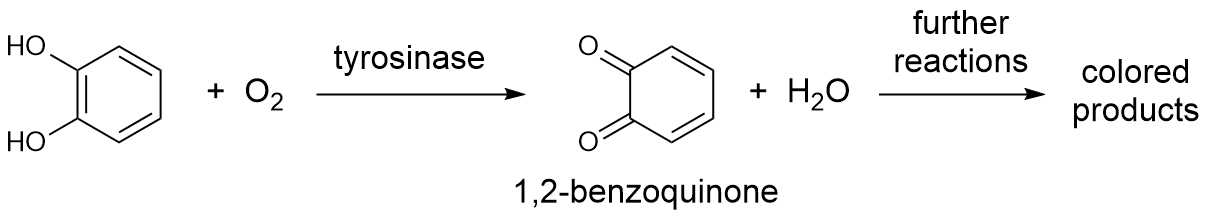
Catechol as a Substrate for Tyrosinase
Previously, we used L-DOPA as a substrate for tyrosinase. One year ago CHE 341 students discovered that the low solubility of L-DOPA (~0.015 M) makes it difficult to reach Vmax conditions with inhibitors present. As a result, this week, we are going to use an alternative tyrosinase substrate, catechol, which is soluble up to 3.9 M! The product from catechol reaction by tyrosinase is 1,2-benzoquinone, a yellow compound that can react with water to yeild uncolored 1,2,4-trihydroxybenzene or rapidly react with itself to form a mixture of yellow dimeric products.5 Since it is not possible to conveniently monitor the concentrations of all species in such a mixture, we will monitor absorbance at 400 nm and define a custom enzyme unit of activity: one catecholase unit (CU) equals the increase in absorbance at 400 nm per minute in the full assay volume expressed in μL (1 CU = 1 A400·μL·min-1) when catechol is the substrate. Recall that standard enzyme units (U) are μmol·min-1. Since absorbance is proportional to concentration, you must multiply by the volume to convert concentration per minute (e.g. μmol·L-1·min-1) to amount per minute (e.g. μmol·min-1) as in Lesson 2.