Ans: Predictive Analytics Software / Statistical Package for the Social Sciences
-
195 13 43 62 51 39 41
|
Ans:
|
Ans: A mathematician and statistician that taught at Princeton. He lived from 1915 to 2000.
Ans: It is a method for easily determining Q1 and Q3: Q1 is the median of the bottom half of the sorted list; Q3 is the median of the top half of the sorted list. If the list has an odd number of items, the middle item is counted in both halves of the list.
-
Sample mean
Q0
Q1
Q2
Q3
Q4
Stem Plot
Box Plot
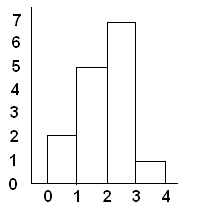
Histogram