Ans: When the histogram of the dataset is normal: symmetric and there are no outliers.
Ans: When the histogram is skewed and/or there are outliers.
| Bin | Percent |
|---|---|
| [0,1) | 20 |
| [1,2) | 30 |
| [2,3) | 20 |
| [3,5) | 20 |
| [5,9) | 10 |
Since the bin widths are not all equal, the area of a rectangle represents the frequency, not the height. Now answer these questions about the histogram:
- Without doing any calculations, what is the median of the
histogram in Problem 3?
Ans: The median is exactly at 2 (50% of observations to the left, 50% to the right).
- Is the mean in Part a greater than or less than the
median?
Ans: It is greater then the median. The long tail pulls the mean to the right. The exact value of the mean is computed as this weighted mean:
_ 0.5*20 + 1.5*30 + 2.5*20 + 4.0*20 + 7.0*10 254 x = ------------------------------------------ = --- = 2.54 20 + 30 + 20 + 20 + 10 100 - What is your best estimate of the percentage of observations
in these bins?
-
a. [4,5) b. [7,8) c. [4,6)
Ans: The formula for SD uses n in the denominator before taking the square root; the formula for SD+ uses n-1. Most statisticians use SD+ because it takes into account of the extra variability that results in using x to estimate μ.
- 4 4 4 4 4
Ans: 0.
- 0 0 0 0 10
10 10 10
Ans: SD is exactly 5; SD+ is a little more than 5, actually 5.35.
- every observation is increased by 7? Ans: SD is unchanged.
- every observation is multiplyed by 3? Ans: SD is multiplied by 3.
- the largest observation is increased by 1000?
Ans: SD increases, but it is hard to say by how much.
Ans: SD = sqrt(SS / n), where SS = sum of squares of deviations. Solve 6.94 = sqrt(SS / 23) for SS: SS = 1107.76. Then SD+ = sqrt[SS / (n - 1)] = sqrt(1107.76 / (23 - 1)) = 7.06.
-
20 10 15 15
- Compute x and SD+.
Ans: Analyze >> Descriptive Statistics >> Descriptives.
- Create a histogram with 5 bins.
Ans: Graphs >> Chart Builder. Drag a Simple Histogram in to the Chart Preview Area.
- Create a scatterplot of t2 vs. the observation number.
Ans: Graphs >> Chart Builder. Drag a Simple Scatterplot into the Chart Preview Area.
Ans: Data >> Sort Cases. Set the Sort Order to Ascending or Descending as you prefer.
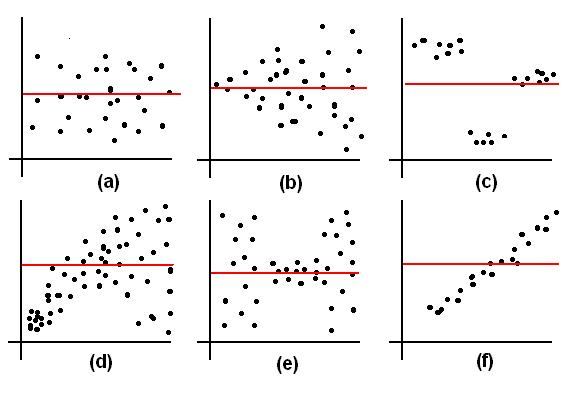
-
Unbiased The average of the observations in every thin
vertical strip is the same all the way across the scatterplot.
Biased The average of the observations changes, depending on which thin vertical strip you pick.
Homoscedastic The variation (SD+) of the observations is the same in every thin vertical strip all the way across the scatterplot.
Heteroscedastic The variation (SD+) of the observations in a thin vertical strip changes, depending on which vertical strip you pick.