Recommended Reading
- Wilson and Walker 5.2
- Use of Standard Curves from Lab 1
Lecture Video
Specific Activity of Your Tyrosinase Extract
In Assignment 2, you calculated activity in units of tyrosinase activity per volume (U/mL). In principle, this is an activity measure that is comparable between groups. However, in practice, variations in extraction technique from group to group affects how much of the total protein in the mushroom was actually extracted from a given sample. Because of this problem, the best measure to compare is units of tyrosinase activity per mass of total protein (U/mg of protein). The activity of an enzyme per unit mass is called specific activity. The simplest method for calculating specific activity is to divide relative enzyme activity (in activity per volume) by the protein concentration (in mass per volume).
$$ \textit{Specific Activity } \mathrm{(U/mg)} = Relative Activity (U/ml) / Total Protein Concentration (mg/ml) $$Since our objective is to compare data from different extractions, this week you will measure the concentration of protein in your sample.
Controlled experiments
Instead of giving you one procedure for measuring protein concentration, this week we wish for you to compare the four major methods. No method of protein concentration determination is perfect because each method has different constraints. Based on your experiences, theoretical understanding of the differences between the methods, and the quality of your data, you will make a judgement of which method is best suited for the task of calculating specific activity. To evaluate different methods, you will need to consider which methods (1) give you the most precise results based on the reproducability of replicates, (2) which give you the most accurate results by quantifying an unrelated positive protein of known concentration, and (3) which are the most appropriate based on their chemical principles.
With so much to consider, it is essential that your assays be well controlled experiments. In addition to experimental samples, a controlled experiment introduces samples known as controls that validate the experimental results by ensuring that the experiment is working properly, eliminate alternate explanations and experimenter bias, and in improve confidence in the results. There are generally four types of controls: positive, negative, randomization, and blind experiments. The latter two are particularly important in experiments in which the observing scientist can either influence the outcome or unintensionally bias the data(e.g. clinical trials on human subjects). These are often not necessary in biochemistry. On the other hand, positive and negative controls should be included in any measurement when possbile. Consideration of your controls will be crucial for evaluation of the four protein assays.
A positive control is used in experiments to confirm that the system is functioning correctly and can produce a detectable result. It involves conditions where a known response or effect is expected. If no effect is observed in the positive control, the experimental procedure may be questioned. This week, our positive control will be assay samples that contain a known concentration of a reference protein.
A negative control is used in experiments to ensure that there is no effect when there shouldn't be, providing a baseline for comparison. It involves conditions where no response or effect is anticipated. If an effect is observed in the negative control, external or unknown factors might be influencing the results. This week, our negative control will be assay samples that contain no protein.
Methods of Protein Concentration
The remainder of this page provides background information related to this last criterion. Issues of precision and accuracy will be discussed in lab.
As you can see from the table below, there are a number of ways that protein concentration can be determined. Each has advantages and limitations. During our meeting for Lab 4, we will evaluate these details along with our collective results to select the most appropriate protein concentration method to normalize our kinetics measurements.1

The following sections summarize the most important theory concepts behind each method we will use.
Bradford Assay
 The Bradford assay2 uses a dye called Coomassie Brilliant Blue G-250. This dye contains multiple, negatively charged groups which bind tightly to positively charged amino acids, while the aromatic groups in the dye's core stack with aromatic residues. The dye binds arginine, tryptophan, tyrosine, histidine, and phenylalanine residues on the protein's surface, but binds arginine eight times more tightly than the others. This results in a coloration that is more arginine-dependent than protein dependent, as proteins with more surface arginines will give a higher absorbance than proteins at the same concentration with fewer exposed Arg residues.
The assay measures protein concentration due to the change in coloration of the dye upon complexing with protein. Free Coomassie dye has a max absorbance at ~460 nm, while the protein-complexed dye has a max absorbance at 595 nm. This shift allows detection of the amount of complexed dye, and therefore the total protein. However, the linearity of this assay breaks down at high protein concentrations due in part to the partial absorbance at 595 nm of the uncomplexed Coomassie dye.

Lowry Assay
The Lowry assay is a combination of two colorimetric steps, an improvement on the previously discovered Biuret (pronounced BYE-you-ret) assay mentioned in the table above. The first step involves the binding of a Cu2+ion to four peptide nitrogen atoms. This reduces Cu2+ to Cu+, creating a color change from blue to purple that is detectable, but insensitive. This colorant is also sensitive to free amines, Tris buffer, and EDTA, which will complex the copper and prevent the colorimetric reaction.

The second step is the reduction of the Folin-Ciocalteu reagent (pronounced FOE-lean-CHO-cal-toe), a mixture of phosphomolybdate and phosphotungstate, by tryptophan, tyrosine, and cysteine. This reduction produces a blue-green color known as molybdenum blue, which absorbs at 660 nm. Copper ions increase the rate of reaction with the reacting group. This secondary reaction increases the sensitivity of protein measure one-hundred fold, down to 1 μg.
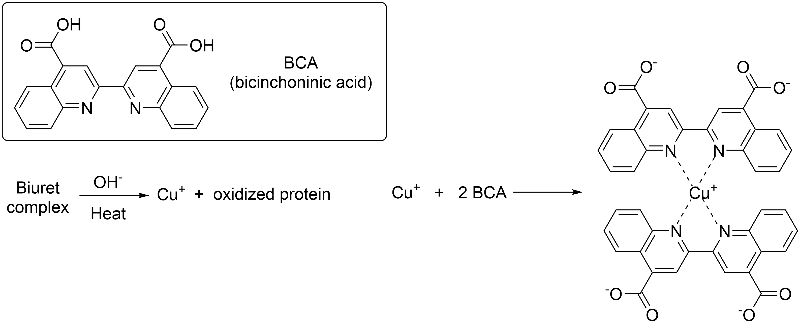
BCA Assay
The BCA assay3 is very similar to the Lowry assay, but replaces the Folin-Ciocalteu reagent with bicinchoninic acid (BCA). As in the Lowry assay, Cu2+ is reduced to Cu+ in the presence of peptide bonds. This Cu+ is chelated by two molecules of BCA, forming a violet complex that absorbs strongly at 562 nm. At room temperature, only tryptophan, tyrosine, and cysteine can assist in the formation of the colored complex. At temperatures above 37 °C however, the peptide amines assist in the formation of the colored complex, increasing the sensitivity of the assay, and decreasing reaction dependence on the peptide sequence.
UV Spectrophotometry Assay
The unique UV-active functional groups in proteins are tyrosine, tryptophan, and disulfide crosslinks. They have significant absorbance in the UV spectrum at 280 nm, thus this wavelength is used for protein quantification. Because the compsition of proteins differ, extinction coefficients vary greatly from protein to protein. Direct UV measurement2 is carried out at 280 nm using on of two methods. It is most accurate is to calculate the extinction coefficient for the protein you are studying. If this is unknown, you can use the rough approximation that ε = 1 mg·ml-1·cm-1 for a general protein solution. Absorbances taken from the spectrophotometer can then be directly converted into concentration using A=εlc (Beer's Law).
To determine the extinction coefficient for tyrosinase, visit PEPSTATS. Copy the sequence for Agaricus bisporus tyrosinase (found at the bottom of this linked page) into the pepstats window, scroll down, then click "Run job." From here, you will be able to see information about this protein. Record the molecular weight, the number of residues, and the ε280 molar extinction coefficient. Note that there are two numbers given for the extinction coefficient, one for the "reduced" form and one for the "cystine bridges" form. The latter value include A280 absorbance of disulfide bonds. Since we will be using the native form of tyrosinase, and not the reduced form, the "cystine bridges" extinction coefficient is the one that you should use for your UV measurements.
Consider the problems that might arise from using the tyrosinase extinction coefficient on a crude protein extract, which we expect to have many other proteins in it.
The timing of protein concentration assays
This week you will carry-out four different methods for determining protein concentration. You should plan carefully if you want to complete this lab in a timely manner. The three colorimetric assays require you to generate the same BSA standard curve. The Bradford assay is the easiest and quickest. You should perfect your technique on this one. The BCA assay is expensive and you will only have enough reagent to try it once. Conduct this one last. The direct UV measurement is rapid and is not time sensitive, so it can be done at any point during the lab period.
|
Assay |
Development time |
When to measure color |
|
Bradford |
10 mins |
within 60 mins |
|
Lowry |
40 mins |
within 30 mins |
|
BCA |
15 mins plus cooling time |
color never stops changing, |
|
A280 |
none |
can be measured anytime |