1. CSC 578 "Default" Final Project (Time Series Kaggle)
Overview
The goal of the project is to apply deep learning to do time series forecasting. In particular, you will create Recurrent Neural Networks (RNNs) to predict future traffic volume at a location in Minnesota, between Minneapolis and St Paul.
Tensorflow has created a tutorial on for time series data. You can use it as the basis of your code when you start. But be sure to strip out content/cells that are only tangential for your project when you create your submission code.
Like the previous homework, this task of model building is made into a Kaggle competition (https://www.kaggle.com/t/12e81c7f46e845339c9f3d6d693713bc). The competition closes at 6:59 pm on June 12 (Wednesday), while the deliverables are due 11:59 pm on June 13 (Thursday).
Details of the Task
Dataset
The dataset we will use is a subset1 of the Metro Interstate traffic volume from the UCI repository. Here are:
- the data file (in csv)
- the data set description
You can either:
- download the data (from the competition site or the link above), then upload it to Google drive, and mount your Google drive, or work on your local machine,
directly load the dataset into colab from a shared site (hosted by Prof. Hastings) by specifying the path (csv_path below), and reading the file from the path into a pandas dataframe (as you usually do)
csv_path = tf.keras.utils.get_file(
    origin='https://reed.cs.depaul.edu/peterh/Essays/Metro_Interstate_reduced.csv',
    fname='Metro_Interstate_reduced.csv',
    cache_dir='/content', cache_subdir='sample_data')

csv_path
# should be '/content/sample_data/Metro_Interstate_reduced.csv'
In this subset, there are 40,575 rows (plus a header row), with 9 columns/features:
- holiday: string (None or name of holiday)
- temp: in degrees kelvin
- rain_1h: in mm for the last hour
- snow_1h: in mm for the last hour
- clouds: percent
- weather_main: short descriptive text
- weather_description: longer descriptive text
- date_time: in M/D/Y H:m:s AM/PM format
- traffic_volume: # of cars in the last hour
How to start
Work through the tensorflow time series tutorial, but apply it to the traffic data instead of the weather data. Work your way toward the single-step Recurrent Neural Network model which uses an LSTM. That will be the goal, but you can also look at the other models to compare them. As preliminary milestones, you should create a simple baseline model as shown in the tutorial, and a vanilla LSTM baseline model which is just the "Recurrent neural network model" from the tutorial, fitted to the prediction window described below with no hyperparameter tuning.
Specific goal
The specific goal will be to predict from a 12-hour input window, to predict the traffic volume (only) which is 3 hours past the end of the window. That is a little different from the single-step (and multi-step) RNN with LSTM examples, but it will make it much easier to compare results within kaggle.
Initial things to watch out for -- Do these (if you decide to do any at all; up to you) BEFORE you split the data into training/test sets.
- As with the weather data, you may want to transform some of the features in some way.
For example,
- For categories are strings, you can decide whether to just ignore them, or replace them by a more useful representation of the same information. (*)
- You can also decide what to do with periodic data, but you probably don't want to ignore them.
Training / Test split
Following the TF tutorial's example for splitting the data into training, validation, and test sets, except use the first 35,575 rows as the training set and the remaining/last 5,000 rows as the test set. So if you associate an unique 0-based ID number for each instance, the training set will contain rows whose ID numbers are from 0 to 35,574 (both inclusive), and the test set will contain rows whose ID numbers are from 35,575 to 40,574 (both inclusive).
It's up to you to decide whether or not to use a validation set (and its proportion from in the training set). But if you decide to use one, be sure to take them from the last (contiguous) rows from the training set.
IMPORTANT:
- DO NOT SHUFFLE THE DATA, before or after the train/test splitting, for any set. That should be obvious because this is a time-series data.
- Normalize each dataset separately. Actually it's up to you to decide if you want to normalize certain features. But if you do decide to normalize the target feature (traffic volume), be sure to un/de-normalize the predicted values generated by the model.
Data Windowing
- The tutorial code has the class 'WindowGenerator'. You can use it if you like. But remember, in our case, 'input width' is 12 (hours), 'offset' is 3 (hours) and 'Label width' is 1.
- Also for the target feature, you only pull out the traffic volume column; NOT the entire nine features of the hour.
- As a hint, if you create the 'windowed' datasets correctly, the training set should have been converted/windowed to have 35,561 rows, and the test set should have been converted/windowed to have 4,986 rows (whose row ID's (0-based, from the original dataset) are from 35,589 to 40,574 both inclusive).
Further Experiments
- After building a baseline model (that is, the basic RNN/LSTM model), you may try exploring advanced features and architectures such as:
- Batch size
- Number of recurrent units
- Stacking recurrent layers
- Statefulness
- Recurrent dropout
- Bidirectional RNNs
- Combining CNNs with recurrent networks
-- Note: Conv1D's kernel size and stride are
dependent on the dataset you set up ((*) above). Here is a
good reference.
- 1D convnet + RNN
- 1D convnet + GRU
- FYI, if you are interested in knowing about the performance optimization by GPUs, look at the section "Performance optimization and CuDNN kernels " at Keras Guide on RNNs.
- References:
- This site How to Develop LSTM Models for Time Series Forecasting (and the same code at Multivariate Time Series Forecasting with LSTMs in Keras) has code example for creating rollout data.
- Ditto this Multivariate Time Series using RNN with Keras, although the example is Univariate.
- This site Prediction and Analysis of Time Series Data using Tensorflow is a very useful reference on time-series data, in particular generating predictions (and using Keras), although again the example is Univariate.
- This site A comprehensive beginner��s guide to create a Time Series Forecast (with Codes in Python and R) has quite intuitive and concise explanations on some of the fundamental concepts in Time-series in Statistics.
- Finally, the general Keras reference on Working with RNNs. This is an EXCELLENT page on Keras RNNs (for TF2).
Kaggle Submission File
After you train the model, you produce predictions for the instances in the test set. Then you create a Kaggle submission file.
- Create a .csv submission file of the form where:
- The first/header line should be "id,prediction", where
id's are the 0-based indices from
35589 to 40574
(both inclusive). It should
look something like the following:
id,prediction
35589,3569.0
35590,4724.5
35591,4735.5
...
40573,2039.0
40574,1546.0
- The first/header line should be "id,prediction", where
id's are the 0-based indices from
35589 to 40574
(both inclusive). It should
look something like the following:
- NO SPACES between the two columns.
- You can name the file as you wish, as long as the extension is ".csv".
- A maximum of 5 submissions per day are allowed to encourage you to optimize intelligently based on your validation results.
- Important Note: If you normalized the traffic volume target feature, you MUST un/de-normalize the model predictions and write the converted values in the submission file.
-
Your submissions will be evaluated against the true answers using Kaggle's Mean Absolute Error metric:
 (where
n is the size of the test set).
(where
n is the size of the test set).
WARNINGS
-
DO NOT simply extract/copy those traffic volume values from the test set and submit them. It will result in an error of 0, which will clearly indicate an invalid (AKA cheating) submission -- you will receive a score of 0 for the project.
- Do not copy the entire tutorial into your submission notebook! Create a new, blank notebook. You may copy some of the necessary code from the TF tutorial, but always preface the parts you copy with the comment
# From TF Tutorial. - For any comments in the code which you include from the tutorial differentiate them by putting either
TFor your initials at the beginning. But it is better to just write your own comments in your own words. - For your submission, only include the parts from the tutorial which are requested here, i.e., the initial code for loading, the Exploratory Data Analysis, the Window Generator code, the RNN / LSTM model, and any variants of that which you make.
You may want to start with another notebook where you work through all the steps in the tutorial (with different windows and models), but do
NOT include them all in the final submission.
- About WindowGenerator code in the tutorial. In the past, some students have gotten confused by that code and adopted some other technique, but it produced the wrong combinations of the multiple inputs and target output that are needed for time series prediction.
You have to think through by yourself.
Use the
plotmethod to make sure you're getting the right window. An example should look like this: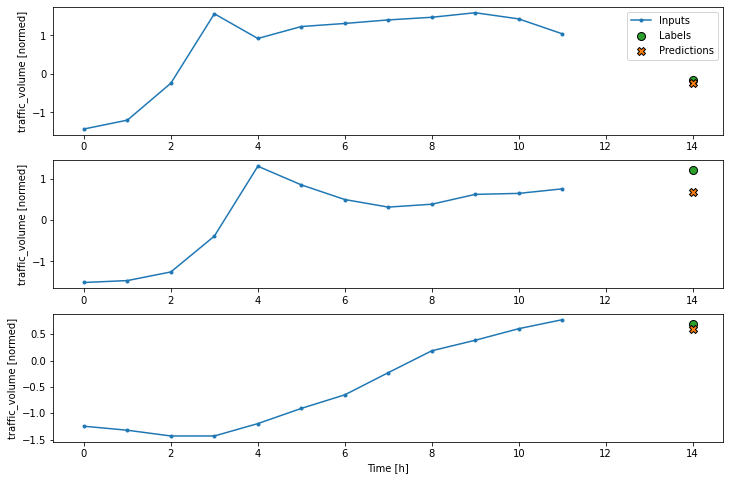
Requirements:
The general project requirements are below:
Participation in the competition is required. Also you must make at least 5 successful submissions.
Make your Jupyter Notebook file clean, readable, well organized and presentable. Make your Notebook file look as professional as you can, like one you'd want to include in your portfolio when you apply for jobs.
NO DRAFT code -- NO debugging print statements, useless empty cells, long run-off lines, etc. Poorly formatted and/or with poor content code will receive a lower grade.- Include Exploratory Data Analysis (EDA) of the data in the introduction part. (You may include significant parts of the EDA in your documentation as well, but don't fill up the document with that. This is a computer science class, not a data science class.) Minimally there should be description of variables, plots and histograms, along with your analysis/comments on the statistical distribution.
- Write code that has good organization, including section headers and descriptions.
- Try at least 4 different models.
- Baseline and Best models clearly labeled in the code.
- Include visualization of the performance for each model.
- Include sufficient amount of code comments that indicate that you understand what the code is doing, not just what the results are.
- Write a documentation report (in pdf).
- Minimum 4.0 single-spaced pages (if you count words ONLY).
- Front matters at the top of the file:
- your name, course/section number and the assignment name
- your Kaggle user name (as displayed in the leaderboard), score(s) and ranking (public or private, or both; at the time of your writing).
- EDA. Keep it concise.
- Data preparation:
- features that are strings -- what you did with them.
- features that are numeric -- method of normalization (and denormalization) if you did any.
- data windowing -- how you did.
- Descriptions of models and development journey:
- a brief summary/abstract of the four models you experimented.
- defails of the baseline model -- description (e.g. type and configuration of architecture, different hyperparameter configurations) and a brief explanation/justification on why you chose it as the baseline.
- defails of the Kaggle-best model -- description and your thoughts/speculation on why that model performed the best.
- details of the "noteworthy/interesting model" and the reason why you thought was 'interesting',
- details of other models.
- various charts to show the training behavior of each model.
- a summary table of the models and their scores.
- Your thoughtful conclusions on the best model, your results and the competition.
- Your reaction and reflection on the project and the course overall.
Deliverables:
The source Notebook file, its html/pdf version, and the documentation pdf/docx file. Upload those files in the Final Project submissions folder on D2L.
NOTE: Higher grades will be given to submissions (including both source and documentation files) that are nicely organized and well written, with a sufficient amount of comments and presentable graphs/charts. Ones with terse, minimal content will be considered insufficient and receive a lower grade.
All files will be processed through TurnItIn, so you should ensure that you do not plagiarize. In particular, although I expect some replication in the code from the original tutorial to your own, you should make sure that you put in your own comments describing in your own words what is happening in the code.
Footnotes:
In the original, there were multiple rows where any of the string features changed during the hour. I removed those extra lines. But I left in the opposite, i.e., where there is more than one hour between adjacent entries. Because of this, you should not use the original dataset.