 |
 |
 |
 |
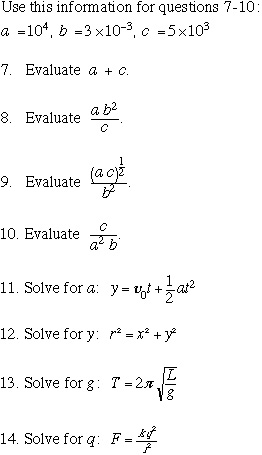
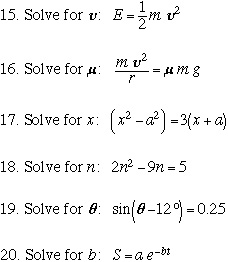
Use your own paper (and a scientific calculator) to answer the following questions, then check your answers.
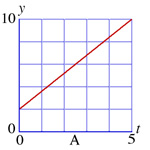
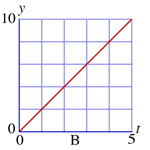
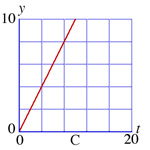
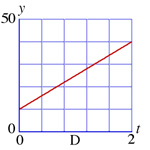
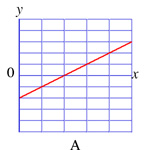
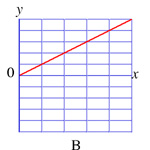
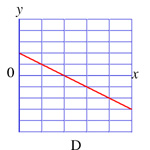
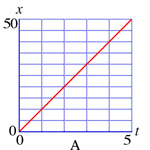
1. Which of these lines has the largest slope?
|
|
|
|
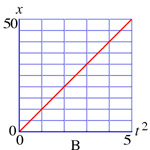
2. Which (one or more) of these graphs represent(s)
a
direct proportion?
 |
 |
 |
 |
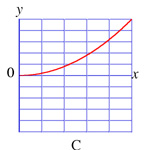
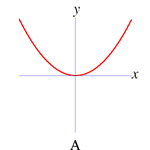
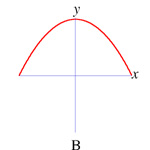
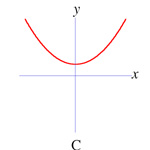
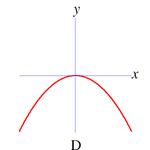
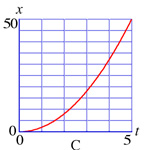
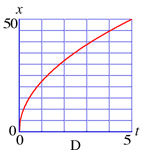
4. Which (one or more) of these graphs
represent(s)
the function y = ax2 ,
where a is
any real nonzero number?
 |
 |
 |
 |
5. Which (one or more) of these graphs
represent(s)
the function x = 2t2?
 |
 |
 |
 |
6. Calculate the distance from point (1,1) to
point
(5,3).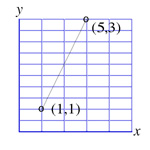
A student beginning College or University Physics (Physics 150 or 170 sequence) should be able to answer most of the above questions with relative ease. A score below 75% indicates math deficiency that should be attended to immediately. See the University Bulletin for the course content of Mathematics 130 and 131, prerequisites for Physics 150 and 170.
Good sources of math review material are Schaum's Outline of College Algebra and Hypermath.