ISP 120 - Quantitative
Reasoning
Group Activity 5: Describing XY Graphs
(For OpenOffice version, Click HERE)
All group activities must include a signed statement from each group member that they participated fully in the assignment.
Please do the following at the beginning of every computer activity.
a. Open a new Word document.
b. Click on the "File" on the top menu bar, then go to "Save As". Give your document a somewhat descriptive name (e.g. "Group Activity 5"). Also save the document to the desktop by setting the "Save in" textbox to "Desktop". (Saving to the desktop makes it easy to retrieve your work when you are finished.)
Learning Goals for this Activity
- You will become acquainted with Excel chart making tools and make an appropriately labeled XY scatterplot.
- You will be able to describe in words the prominent features of a graph: absolute maximum and minimum, relative maxima and minima, periods of increase or decrease.
1. Open the file O'HareTempApril2003.xls, which contains the average daily temperature as recorded at O'Hare International Airport for each day in April 2003. We are going to make a chart of this data and discuss the graph.
a. Select the data with the mouse. Generally speaking it is best to select only the data, not headers and labels. Excel sometimes handles the headers very nicely, but at other times it leads to confusion. You are safer to leave them out.
b.
Click on the "Chart Wizard" button at the top of the
screen: ![]() . The icon
depicts a chart, but it looks more like some books on a shelf. You will
get a menu that looks like:
. The icon
depicts a chart, but it looks more like some books on a shelf. You will
get a menu that looks like:
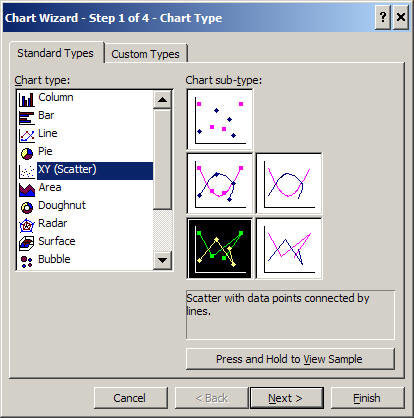
Choose the type "XY
(Scatter)" and choose the "Scatter with data points connected
by lines" subtype  . Which chart type and subtype we use is very dependent on
the nature of the data we are plotting.
. Which chart type and subtype we use is very dependent on
the nature of the data we are plotting.
c. Continue with the chart wizard by clicking on "Next >". Step 2 of the chart wizard gives you a preview of the graph. In this case it will be correct; however, if it is not, the problem often must be fixed by clicking on "Series" tab at the top of message box.
d. Continue onto step 3. Enter an appropriate title for the plot and appropriate labels for the x and y axes.
· Finally, continue onto step 4. You will get a message box that looks like:

You are presented with two choices. You can choose to place your plot as an object on your worksheet or as a new sheet of its own. Both of these choices are useful. Placing on your worksheet makes it easier to resize the plot and make it an appropriate size for transferal to a Word document. Making the plot a new sheet makes the plot fill the screen which is useful for studying the plot and for making presentations. Today, place the chart as an object in Sheet 1.
f. Adjust the dimensions of the graph to make it the way you would like it. Remove the legend by clicking on it and pressing the delete button (Del). Generally speaking, a legend is not needed in a plot with only one data series. The purpose of a graph is to communicate to its intended audience. Make sure that your graph is clear and that a reader would understand what the graph is about. Paste your graph in your Word document.
g. In a well written paragraph in your Word document, carefully describe the graph. In your paragraph you should include details such as absolute maximum and minimum over the whole month, distinctive relative maxima and minima, distinctive periods of increase and decrease, overall patterns of increase or decrease. Overall, what was the behavior of temperature over April 2003?
2. Similarly, open the file USCrimeRates1978-MostRecent.xls which contain crime rates for the US from 1978 to the near present.
a. Make an XY-graph as before and paste it into your Word document.
b. Carefully describe the graph as before. This time also include descriptions of the changing rates of change: when the does the change slow down and speed up?