Ans: It tells you the amount of linear association between the variables.
Ans: Ellipse shaped.
Ans: r = 1 for a perfect positive relationship and r = -1 for perfect negative relationship.
Ans: R-squared is the square of the correlation. It tells you the proportion of variation in the independent variable that can be explained by the variation in the independent variable.
Ans: It depends on the discipline. See this table.
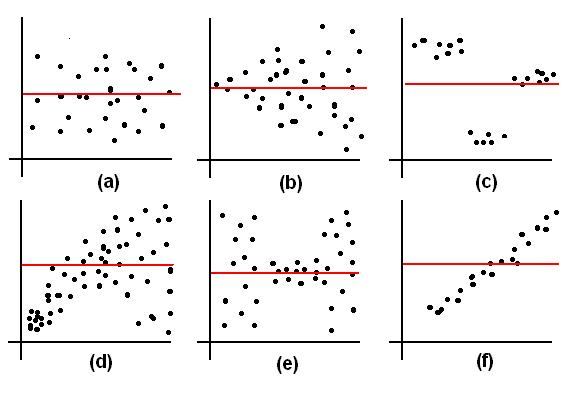
A Homoscedastic means that the SD of the actual measurements is the same for any observation number.
is within 2 SEave
of μ about 95% of the time;
[x - 2 * SEave,
x + 2 * SEave]
is a 95% confidence interval for the true measurement μ.
is within 3 SEave
of μ about 99.7% of the time;
[x - 3 * SEave,
x + 3 * SEave]
is a 99.7 confidence interval for the true measurement μ.
Ans: Using SPSS, we find that
[9.9995954 - 2 * 0.0000006466, 9.9995954 + 2 * 0.0000006466] =
[9.999594107, 9.999596693]
Ans: 0.70
Ans: 0.60
Ans: 1.00
Ans: 1.0
Ans: There are six pairwise correlations to interpret:
| Women | Men | Teenagers | Children | |
| Women | 1 | 0.608 | -0.191 | -0.279 |
| Men | 0.608 | 1 | 0.264 | 0.124 |
| Teenagers | -0.191 | 0.264 | 1 | 0.789 |
| Children | -0.279 | 0.124 | 0.789 | 1 |
Women and: men and women often watch TV shows together, especially if they are dating or married, so they need to agree on which shows to watch. This results in a positive correlation.
Women and Teenagers: Teenagers often like to watch action shows or MTV, whereas (at least according to the stereotype) women like to watch soap operas and romantic comedies, resulting in a negative correlation.
Women and Children: Same comment as women and teenagers. Children also like to watch cartoons.
Men and Teenagers: Men tend to like action shows more than women, which matches what teenagers like. (Maybe men are more like teenagers than woman are, in general).
Men and Children: Same comment as men and teenagers.
Teenagers and Children: This correlation is quite high. Maybe teenagers are more like children than they would like to admit.
Note: The preceding remarks are just speculation. One would have to know the names of the TV shows that they were rating to get a better idea of what is happening.