I make marks and comments in text and the right margin.
Next to a comment, I may note deducted points. These numbers are comments for your information and may be duplicated elsewehere for tracking purposes.
I track deducted points either in the left margin or shape rubrics (see below).
A deduction of "–X" is a warning that points will be deducted in your next assignment for the
same error.
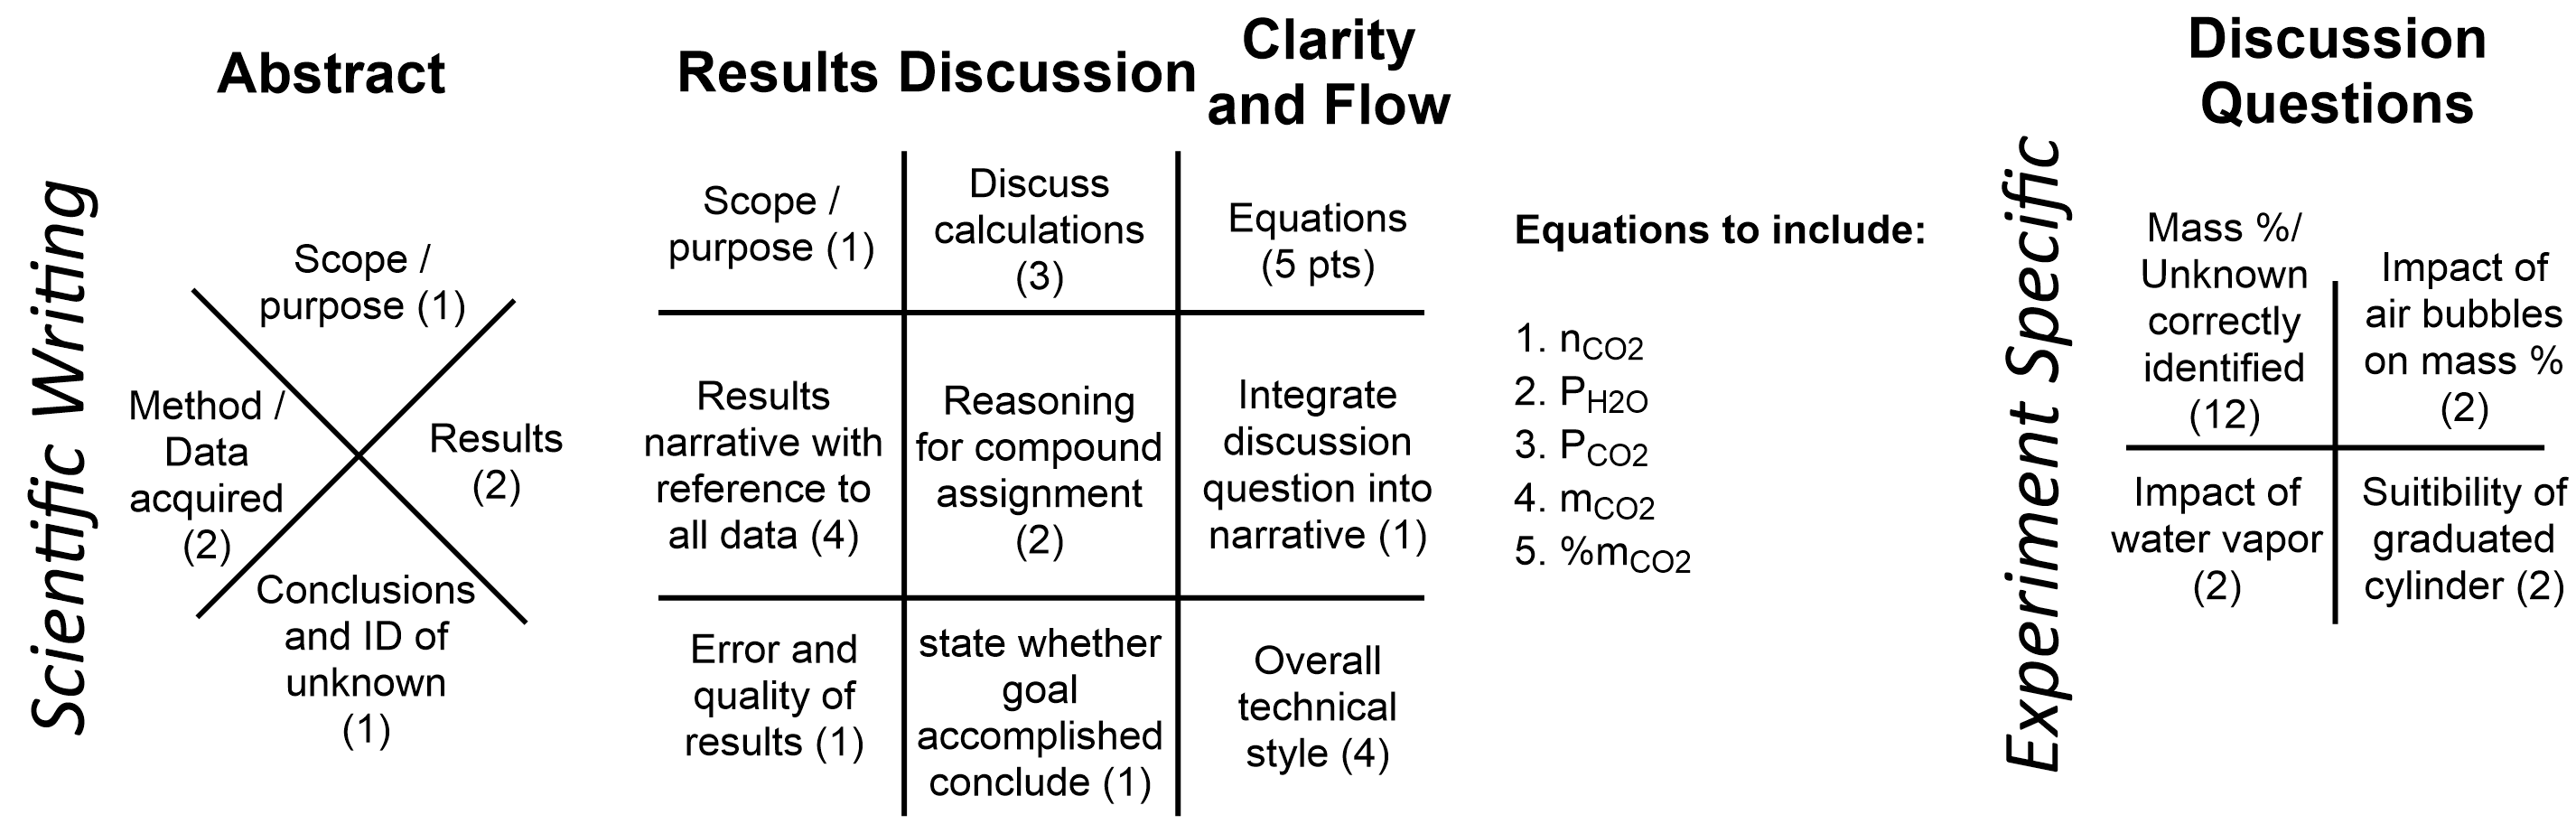
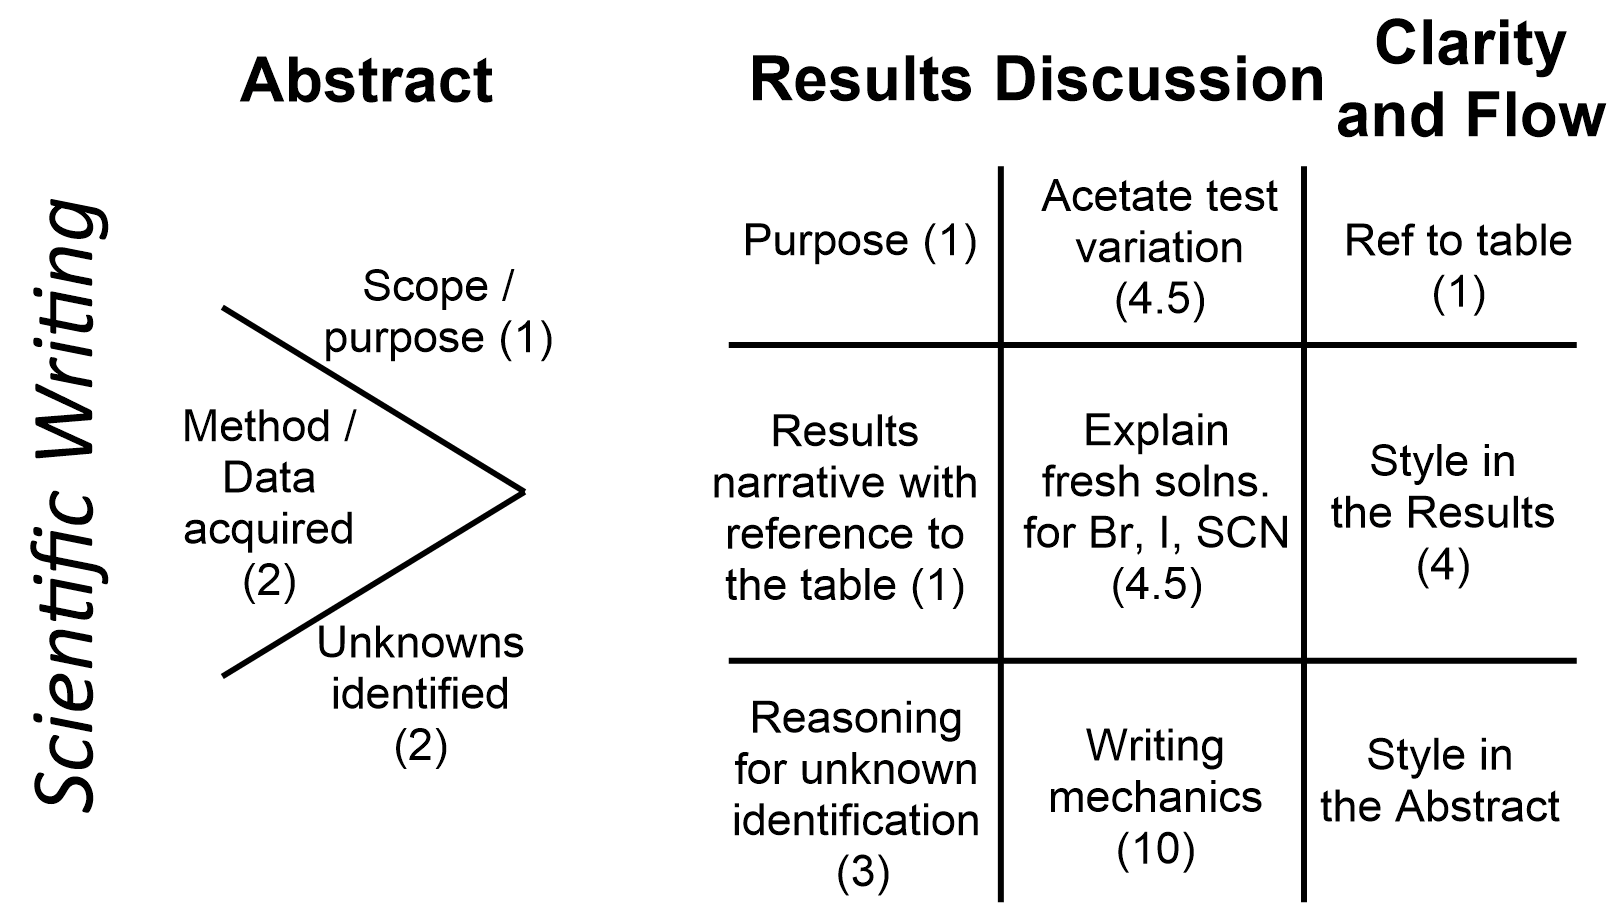
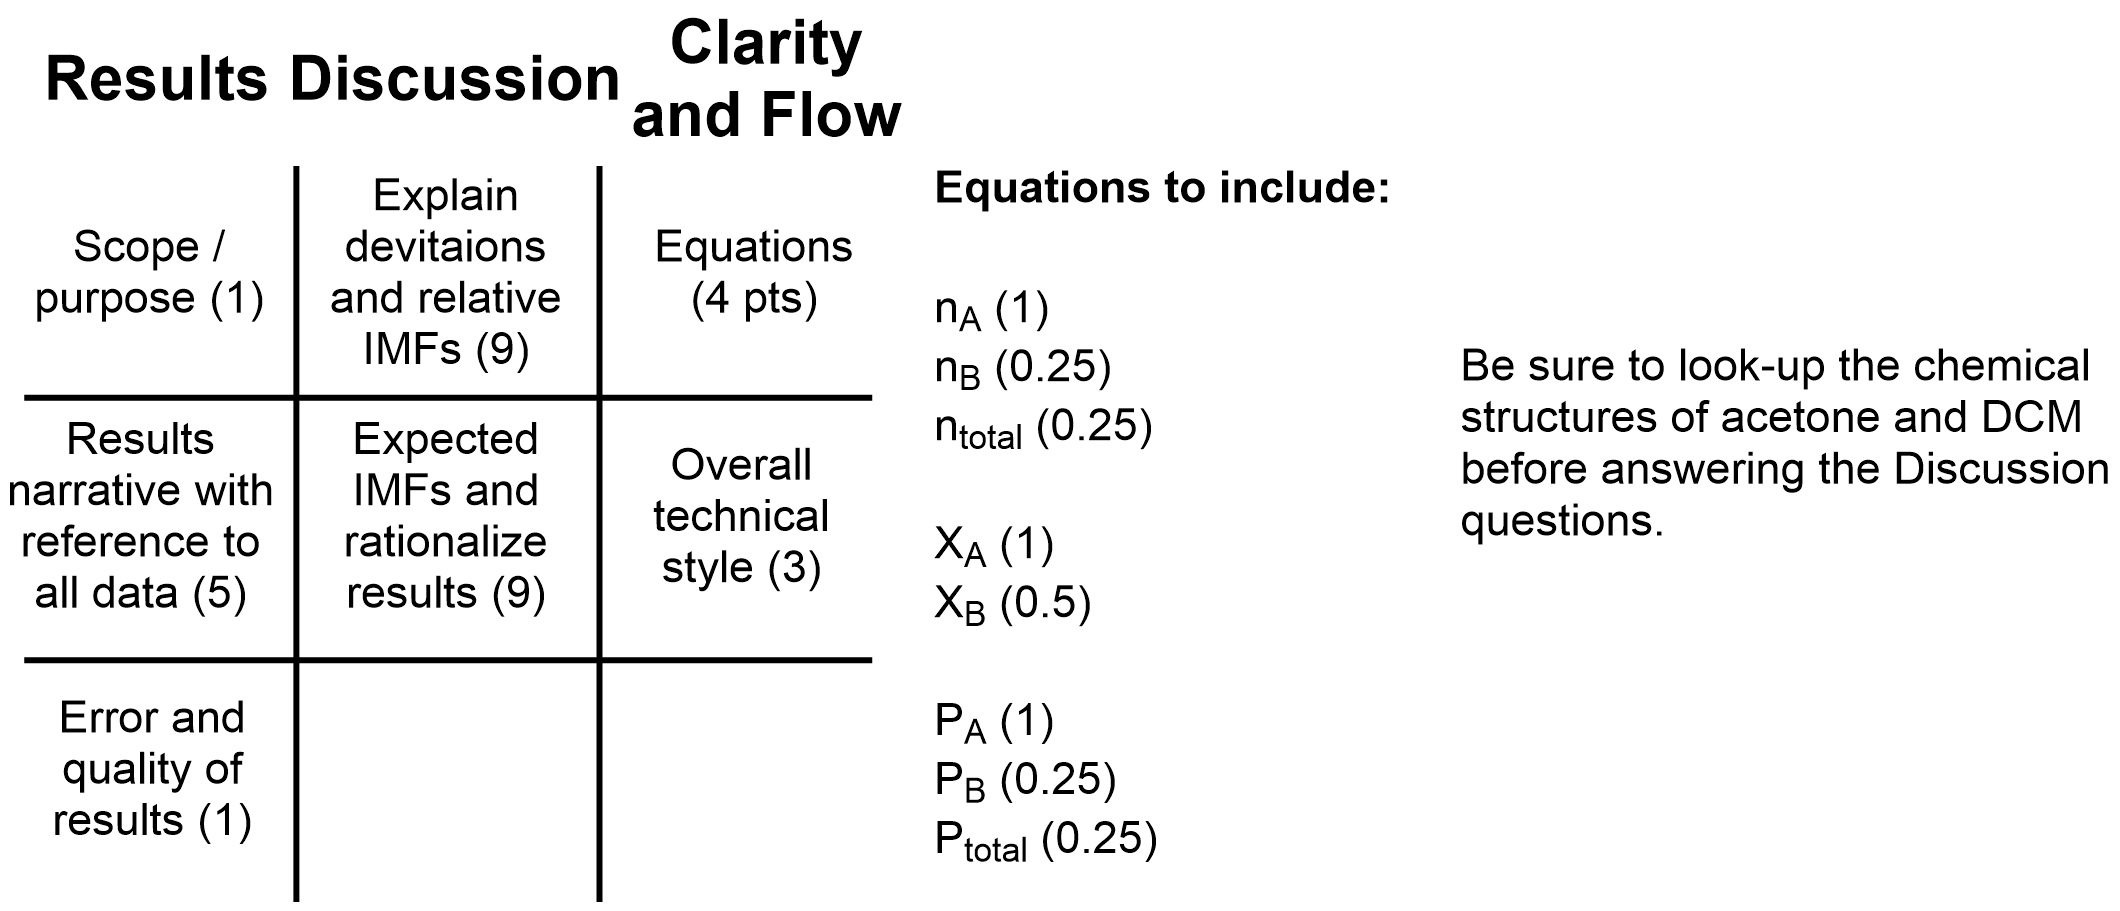
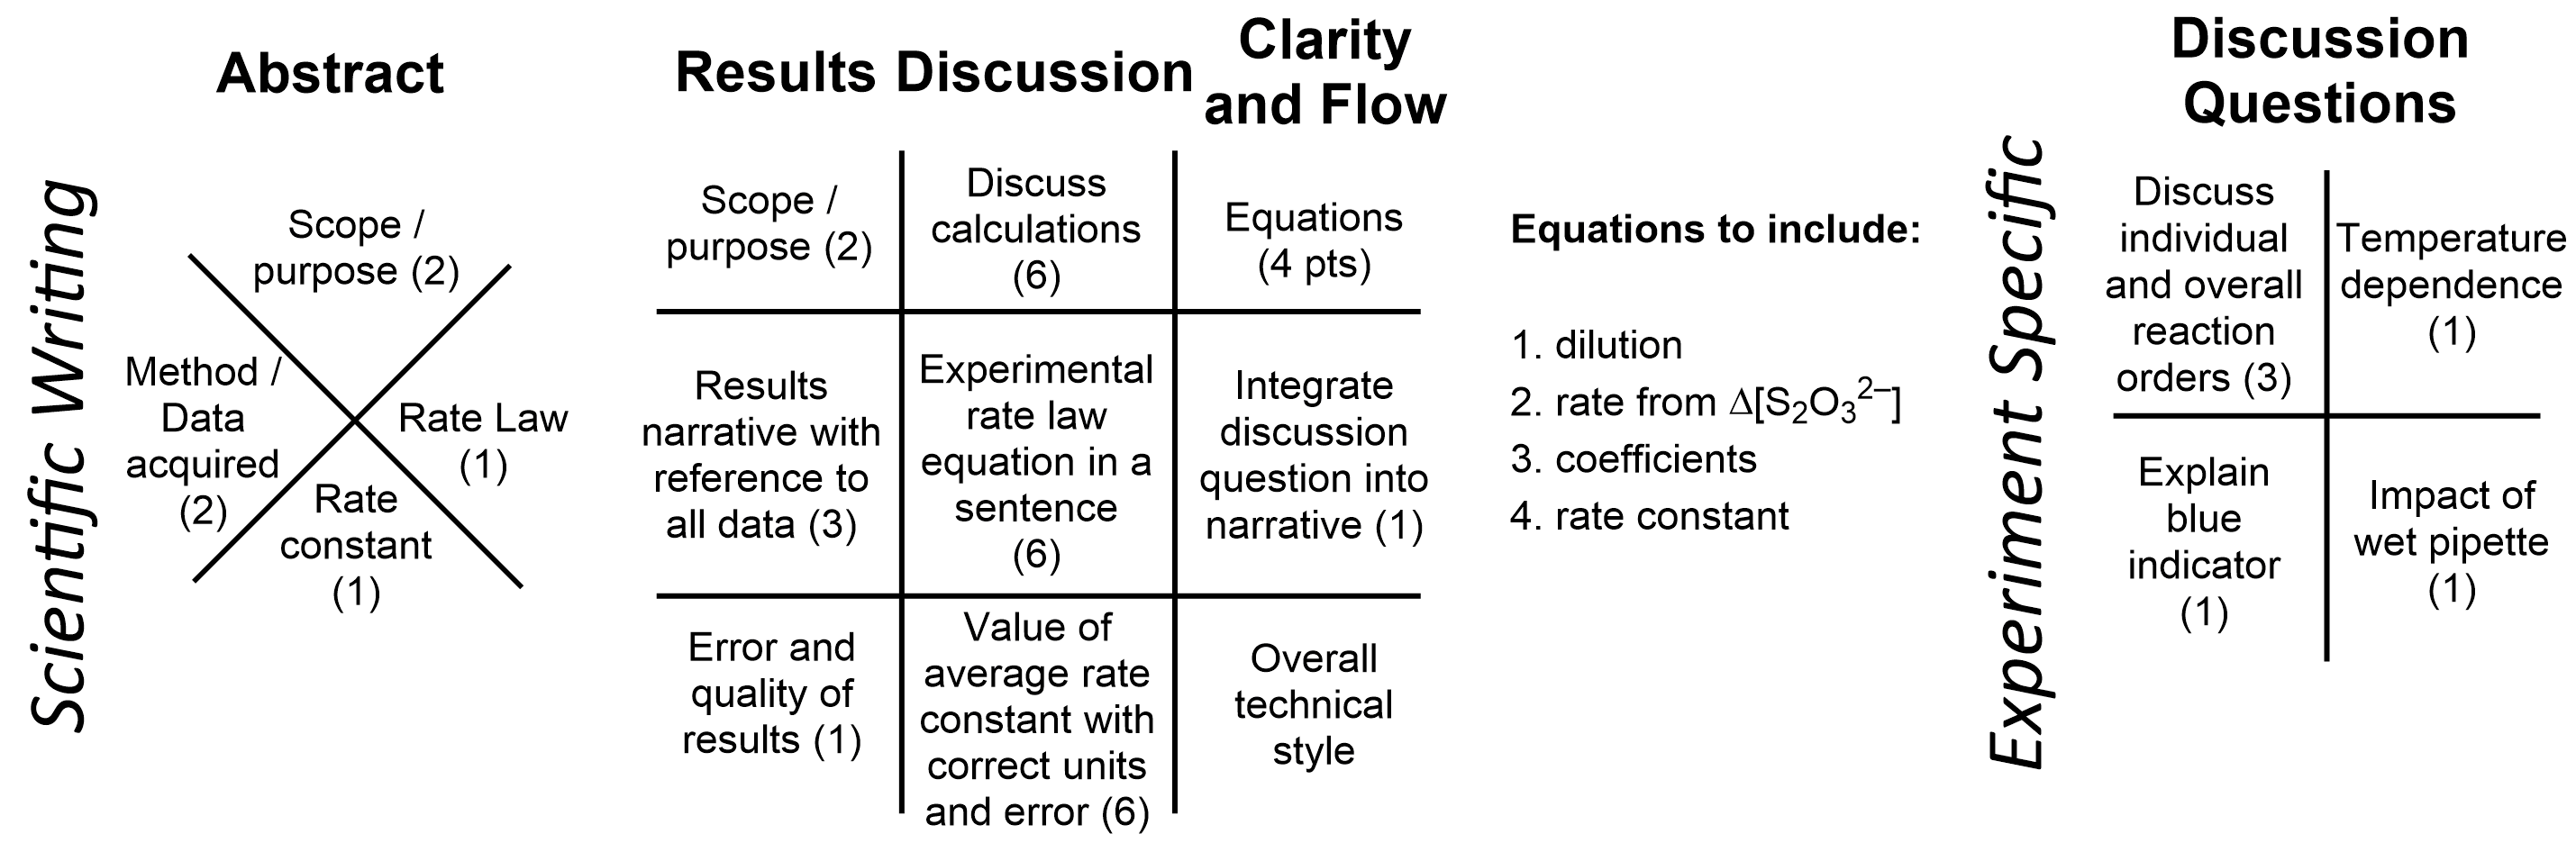
In the shape rubrics below, a checkmark (✔) means you lost no points for the item and a negative number means you lost that many points for the item. Each shape rubric is assignment specific.
The shape rubrics below break-down the scoring for each writing component (they do not cover the graph contents or Excel). Use them as checklist to make sure that you have included everything that is required.
Lab 1
Figure and Table Formatting (10 points):
2 each for three tables = title in the cell above, all categories labeled, units in columns (6 points total)
1 each for four plots = easy to identify with titles (4 points total)
–1 = gridlines on plots
Figures (10 points each):
2 = data plotted
2 = data is good quality
2 = axes labeled
2 = units on axes
2 = trendline equation given (not required for the P vs. V plot)
Excel Calculations (6):
2 = Conversion of °C to K
2 = Calculation of 1/V
2 each for four plots = In cells below each plot, calculate the slope and intercept to 3 significant digits. Include the appropriate units (in cells) to the right of each value.
Discussion Question:
Calculate n by using the slope: n = slope*V/R. Make a valid comparison to n estimated from STP.
Lab 2
Data Table (6 points):
Formatting: 2 = title in the cell above; 2 = categories in columns with units; 2 = trials in rows
Content: 2 = data in all requested categories provided; 2 = correct units; 2 = appropriate sig. figs.
Excel Calculations (6 points):
1 = each of the equations above correctly implemented ; 1 = all categories equations labeled (–1 in more than half of categories are unlabeled)
Lab 3
Excel Calculations (12):
2 = Conversion of °C to K to K–1
2 = Pair with units
2 = ln(Pvap,eth/1 kPa)
2 = Slope with units
2 = Intercept with units
2 = ΔHvap with units
Figure and Excel Spreadsheet Formatting (10 points):
2 = Each experimental data set is clearly labeled
6= Data and calcluations are organized, labeled, and easy to follow
3 = Plots are uncluttered with no gridlines, numbers on axes are easy to read and interpret
Figures, only one trial of each needs to be plotted (10 points each):
2 each for (1) data plotted, (2) trendline graphed, (3) data is good quality, (4) axes labeled, (5) units on axes
Discussion (12 points each):
6 = describe how the features of this nonlinear plot would change, 3 = answer is correct, 3 = explain the reason for your answer
3 = state your value with units, 3 = state the literature value with units, 3 = state percent error, 3 = comment on the difference
Lab 4
Lab 5
Lab 6
Lab 7
Be sure to include the complete rate law in your Discussion. It must be written-out as an equation in the manner described in your textbook, i.e. with the rate constant and the coeffiecients of all non-zero-order reactants. When you define the value of your rate constant, be sure to include the error (with only one significant digit) and the correct rate constant units. Double check that your units are consistent with the overall reaction order.