The Consumer Price Index:
Inflation is a decline in the value of money in relation to the goods that it can buy and is a pervasive economic phenomenon. It is so pervasive that it is very difficult to compare this years prices to last years, much less compare prices over decades. Here is a graph of the buying power of $1.00 since 1938:
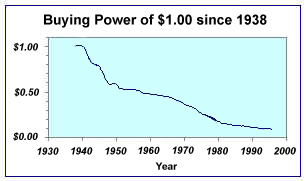
How is the "buying power" of $1.00 measured? How can we compare prices of item in different years? The answer is the use of price indices such as the consumer price index or CPI. Below is a simplified explanation of how the indices are created and how we can use them.
Economists choose a base year and determine the prices of a "bundle" of goods: food, clothing, housing costs, transportation costs, services, entertainment in varying proportions. The proportions for the index we are using (CPI(U)) are
|
Components of the CPI(U) |
|
|
Housing |
41.4% |
|
Transportation |
17.8% |
|
Food |
16.2% |
|
Energy |
8.2% |
|
Medical Care |
6.4% |
|
Apparel and Upkeep |
6.1% |
|
Other |
3.9% |
The cost of this bundle in the base year is assigned an index number of 100. The cost of the same bundle is then determined in a different year. For example, say that 1982 was the base year and the cost of the bundle of goods in 1982 was $1103.46. In 1983 that same bundle cost $1138.91. This means in terms of the bundle chosen,
1103.46 (1982 $)= 1138.91 (1983 $)
Proportionally, this means
1 (1982 $)=![]() (1983 $)
(1983 $)
= 1.032 (1983 $)
Since we assigned the index 100 to 1982, we assign the index 103.2 to 1983. Repeating this process for a number of years results in a table of indices such as the one below.
|
Year |
CPI |
|
1980 |
85.4 |
|
1981 |
94.2 |
|
1982 |
100.0 |
|
1983 |
103.2 |
|
1984 |
107.7 |
|
1985 |
111.5 |
|
1986 |
113.6 |
|
1987 |
117.7 |
|
1988 |
122.6 |
|
1989 |
128.5 |
|
1990 |
135.4 |
|
1991 |
141.1 |
|
1992 |
145.4 |
|
1993 |
149.7 |
|
1994 |
153.6 |
|
1995 |
157.9 |
|
1996 |
162.6 |
The beauty of this table is that we can easily compare any two years prices, not just a given year and 1982. For example, from the table we can see that
in 1980, it would cost $85.40 for goods and services costing $100 in 1982.
But also from the table we can see that
in 1990, it would cost $135.40 for goods and services costing $100 in 1982.
Therefore,
in 1980, $85.40 would buy the same goods and services (on average) as $135.40 would in 1990.
We say that $85.40 in 1980 is equivalent to $135.40 in 1990, or 85.40 (1980 $) is equivalent to 135.40 (1990 $).
The Table below shows the official CPI since 1982. We will explore how it is used.
|
Year |
CPI |
|
1982 |
96.5 |
|
1983 |
99.6 |
|
1984 |
103.9 |
|
1985 |
107.6 |
|
1986 |
109.6 |
|
1987 |
113.6 |
|
1988 |
118.3 |
|
1989 |
124.0 |
|
1990 |
130.7 |
|
1991 |
136.2 |
|
1992 |
140.3 |
|
1993 |
144.5 |
|
1994 |
148.2 |
|
1995 |
152.4 |
|
1996 |
156.9 |
|
1997 |
160.5 |
|
1998 |
163.0 |
The interpretation of the CPI in the last paragraph allows us to compare prices in two different years. For example the price of gasoline in 1990 was $1.16 per gallon on average. In 1997, it averaged $1.23. Was gasoline more expensive or less expensive in 1997? On the face of it, it seems that gas is more expensive in 1997. Economists refer to prices from a given year as nominal or current prices. Nominally, gas was more expensive in 1997. To compare the prices taking into account the changing value of money, we convert one of the prices to the same year as the other. Usually, we convert forward to the more recent year, but one could also convert back to the earlier year. In our example, we want to convert $1.16 1990 dollars to its equivalent in 1997 dollars. Now the CPI table tells us that
130.70 1990 dollars is equivalent to 160.50 1997 dollars.
We wish to know
1.16 1990 dollars is equivalent to ? 1997 dollars.
Perhaps the easiest way to solve this is to set up the proportionality
|
160.50 (1997 dollars) |
= |
x (1997 dollars) |
|
130.70 (1990 dollars) |
1.16 (1990 dollars) |
Solving this proportion (for example by multiplying both sides by 1.16), we find that $1.16 in 1990 was equivalent to $1.42 in 1997. In other words, when Americans paid $1.16 per gallon for gasoline in 1990, it was equivalent to someone paying $1.42 in 1997, which is considerably more that what they were actually paying in 1997. So gasoline was significantly cheaper in 1997 than it was in 1990. Economists say that the equivalent price in a different year is in real or constant dollars. In our example, economists will say that the price of gasoline in 1990 was $1.42 in constant 1997 dollars. The process of converting is often called converting to constant dollars.
(Another way to conceptualize the conversion to constant dollars is to focus on the meaning of the ratio of the CPI's, in the case of the example,
|
160.50 |
|
130.70 |
This ratio represents how many times as much one 1990 dollar was worth in 1997. Multiplying the 1990 price $1.16 by this ratio yields how much $1.16 in 1990 was worth in 1997.)
Another use of the CPI is to convert an entire series of prices to constant dollars. For example, consider the price of electricity from 1990 to 1998:
|
Year |
Average Cost of |
|
1990 |
$0.084 |
|
1991 |
$0.087 |
|
1992 |
$0.088 |
|
1993 |
$0.092 |
|
1994 |
$0.092 |
|
1995 |
$0.094 |
|
1996 |
$0.094 |
|
1997 |
$0.094 |
|
1998 |
$0.087 |
In graphical form, the data looks like:
The graphs shows the price of electricity rising from a minimum of 8.4¢ per kilowatt-hour in 1990 to its maximum in 1997 of 9.7¢. The price drops significantly in 1998 to 8.7¢ per kilowatt-hour. Since the value of the dollar decreased each year, this graph is not a realistic depiction of electricity costs over this period. To get a more accurate understanding, we convert the entire data series to constant 1998 dollars. The spreadsheet image below depicts the calculation. First one would paste in the CPI values (for convenience). Next one would fill a column with the nominal cost multiplied by the ratio of the CPI's involved.
You might wonder why one doesn't use the formula =B2*C10/C2. This formula will not fill correctly, since C10 needs to be used again in each cell (not C11, C12, ...). Another correct formula for this cell is =B2*$C$10/C2, using an absolute cell reference for C10.
Here is the graph of electricity costs in constant 1998 dollars:
In fact, electricity costs went down every year except one from 1990 to 1998. In constant 1998 dollars, electricity costs were at their highest in 1990, when they were nearly 10.5¢ per kilowatt-hour. The cost dropped every year except 1993. The minimum was in 1998, at 8.7¢ per kilowatt-hour. The graph in constant dollars tells a very different (and more realistic) story of electricity costs. In general, most time series in involving money should be converted to constant dollars.
Finally, the inflation rate is defined as the percentage change in the annual CPI. For example, the inflation rate in 1996 was
![]()